
|
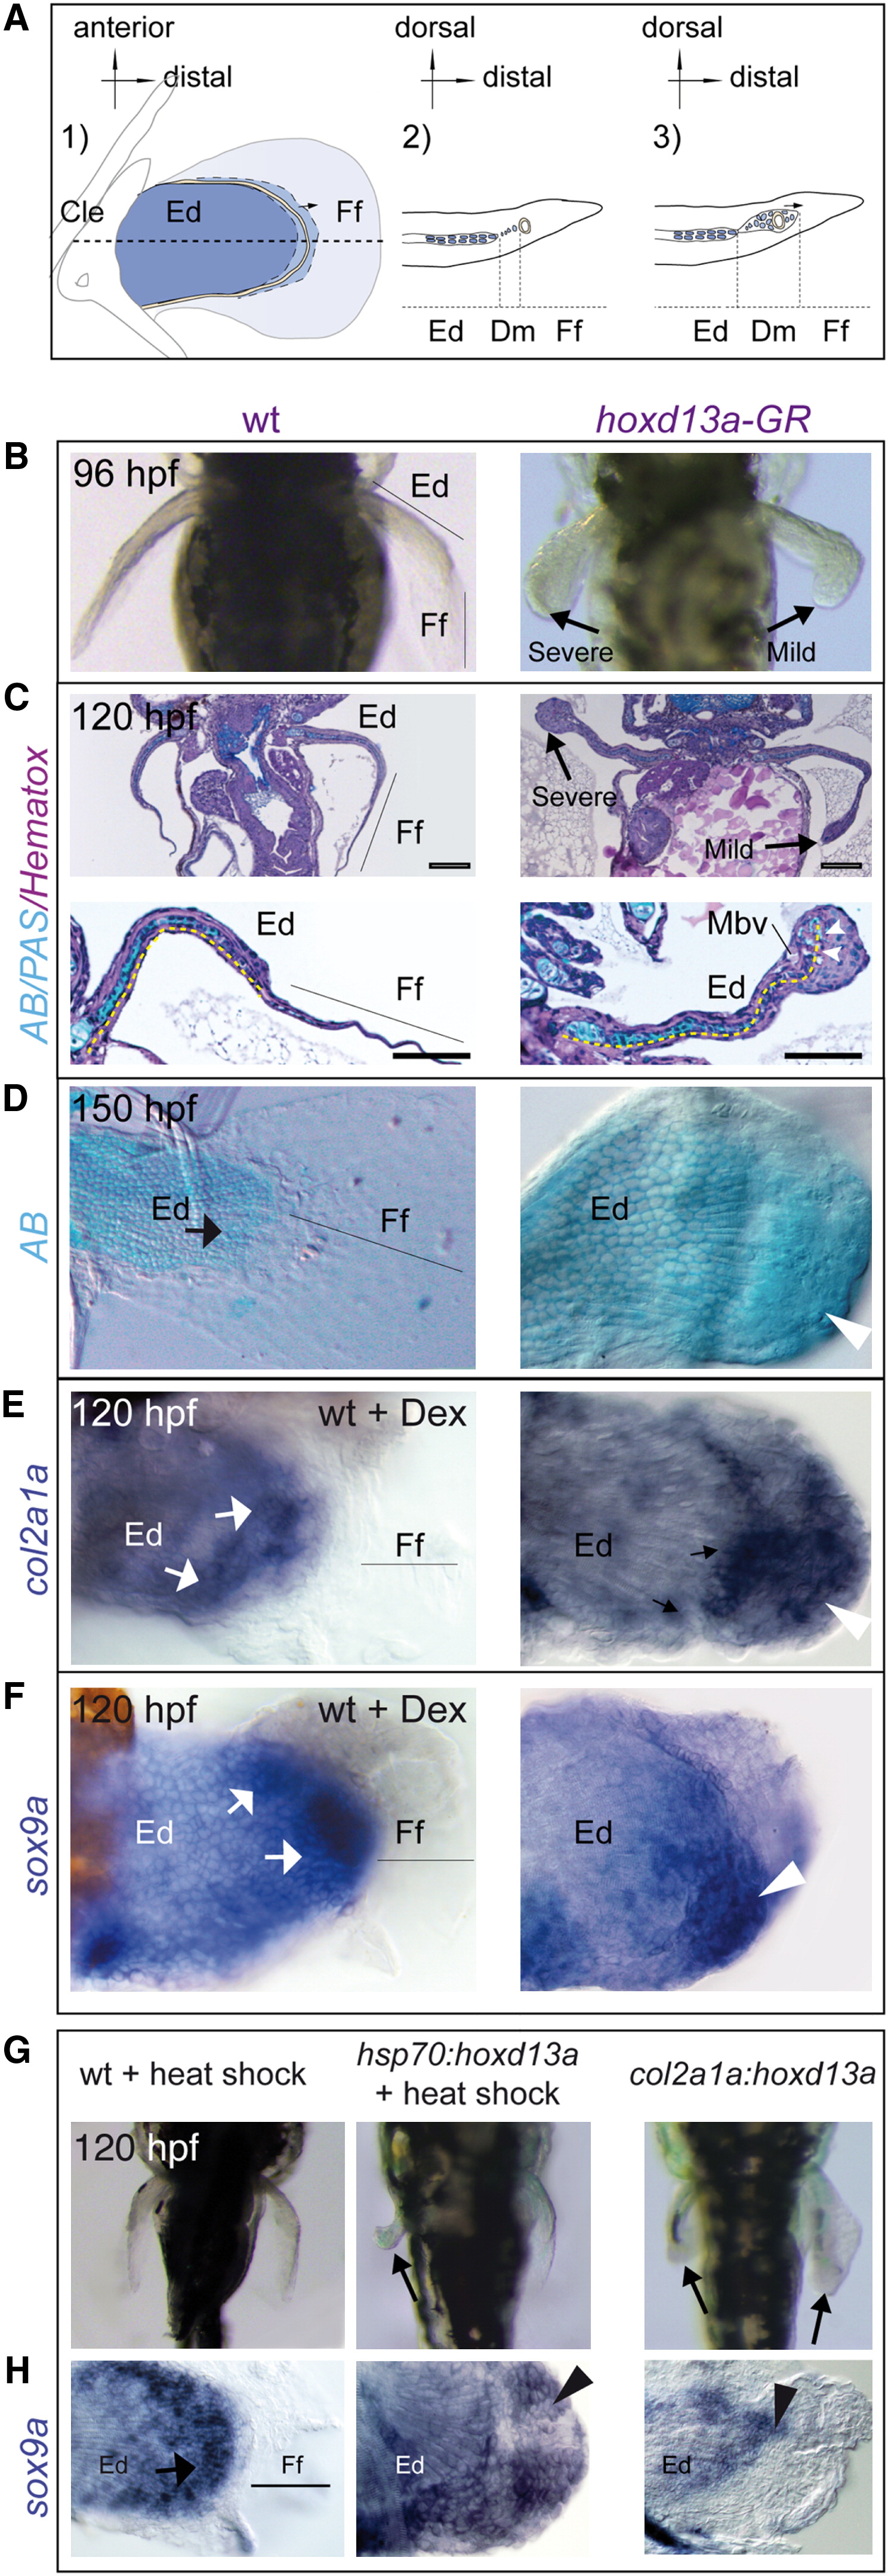
Fig. 1 Effects of hoxd13a Overexpression in Zebrafish Fins(A) Schemes based on Grandel and Schulte-Merker (1998). Endoskeletal disc (Ed) in blue, distal undifferentiated mesenchyme (Dm) in light blue, marginal blood vessel (Mbv) in yellow, ectodermal finfold (Ff) in gray, cleithrum (Cle). Black arrows indicate the distal mesenchymal expansion, taking place during zebrafish fin development. Left scheme (1) shows morphology of a zebrafish pectoral fin at <96 hpf. Dashed line indicates the approximate place where length measurements were performed for statistical analyses. Central (2) and right (3) schemes represent longitudinal sections through fins at two stages of the mesenchymal expansion. Undifferentiated mesenchymal cells (2) are detected at the proximal vicinity of the Mbv at 4 dpf and extend further distally later (3).(B–D) Left and right columns show control wild-type (WT) and hoxd13a-GR injected fins, respectively. Embryonic stages are indicated on the upper left corners of each panel. (B) Different degrees of finfold truncation (severe and mild) are found in hoxd13a-overexpressing fins from 96 hpf onward. (C) Histological sections stained with AB, PAS, and Gill′s hematoxylin (Hematox) show expansion of chondrogenic tissue distally to the Mbv in hoxd13a-overexpressing fins (arrows). Dashed yellow lines represent the length of the chondrogenic tissue measured for statistical evaluations. (D) AB skeleton preparations show staining extending distally in hoxd13a-overexpressing fins (arrowhead) when compared with the controls (arrow).(E and F) col2a1a (E) and sox9a (F) expressions expand further distally toward the area affected by hoxd13a overexpression (arrowheads) when compared with wild-type fins equally treated with Dex (WT + Dex) at the same stage (arrows).(G and H) Fin alterations caused by hoxd13a overexpression controlled by hsp70 and col2a1a promoters. Stages of development are indicated in left up corner for each panel. Left, middle, and right column show wild-type (WT), hsp70:hoxd13a and col2a1a:hoxd13a transgenic fins, respectively. Ed, endoskeletal disc; Ff, finfold. Fins overexpressing hoxd13a show finfold reduction (G, arrows) and show distally expanded sox9a expression domains (H), compare arrowheads in transgenics with arrows in controls fins).See also Figures S1 and S3.
Reprinted from Developmental Cell, 23(6), Freitas, R., Gómez-Marín, C., Wilson, J.M., Casares, F., and Gómez-Skarmeta, J.L., Hoxd13 contribution to the evolution of vertebrate appendages, 1219-1229, Copyright (2012) with permission from Elsevier. Full text @ Dev. Cell