
Image
|
Figure Caption
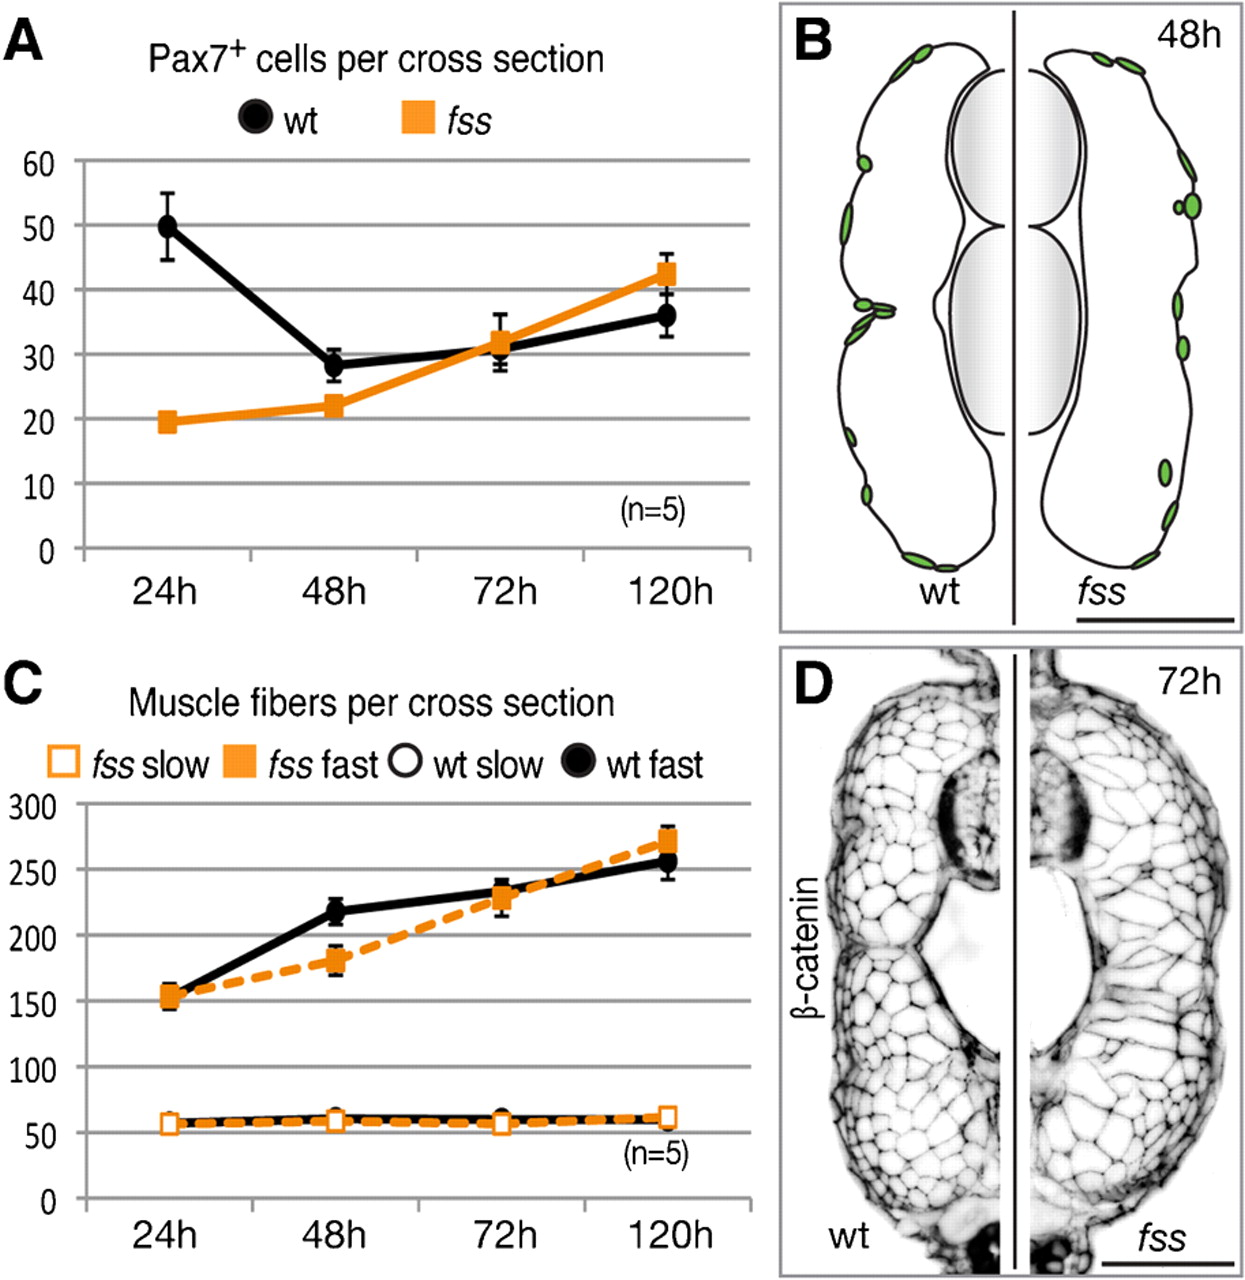
Fig. 4 Dermomyotome recovery and muscle growth.
(A) Graph showing mean number of Pax7+ cells (±s.e.m.) over time. (B) Tracing of Pax7+ dermomyotome nuclei in representative transverse section of wild type sibling (left) and fss/tbx6 mutant (right) at the 48h stage. (C) Graph showing mean number of slow and fast muscle fibres over time (± s.e.m.). (D) Cross-sections showing myotome morphology (β-catenin) at the 72h stage. Scale bars: 50 μm.
Figure Data
Acknowledgments
This image is the copyrighted work of the attributed author or publisher, and
ZFIN has permission only to display this image to its users.
Additional permissions should be obtained from the applicable author or publisher of the image.
Full text @ Biol. Open