
|
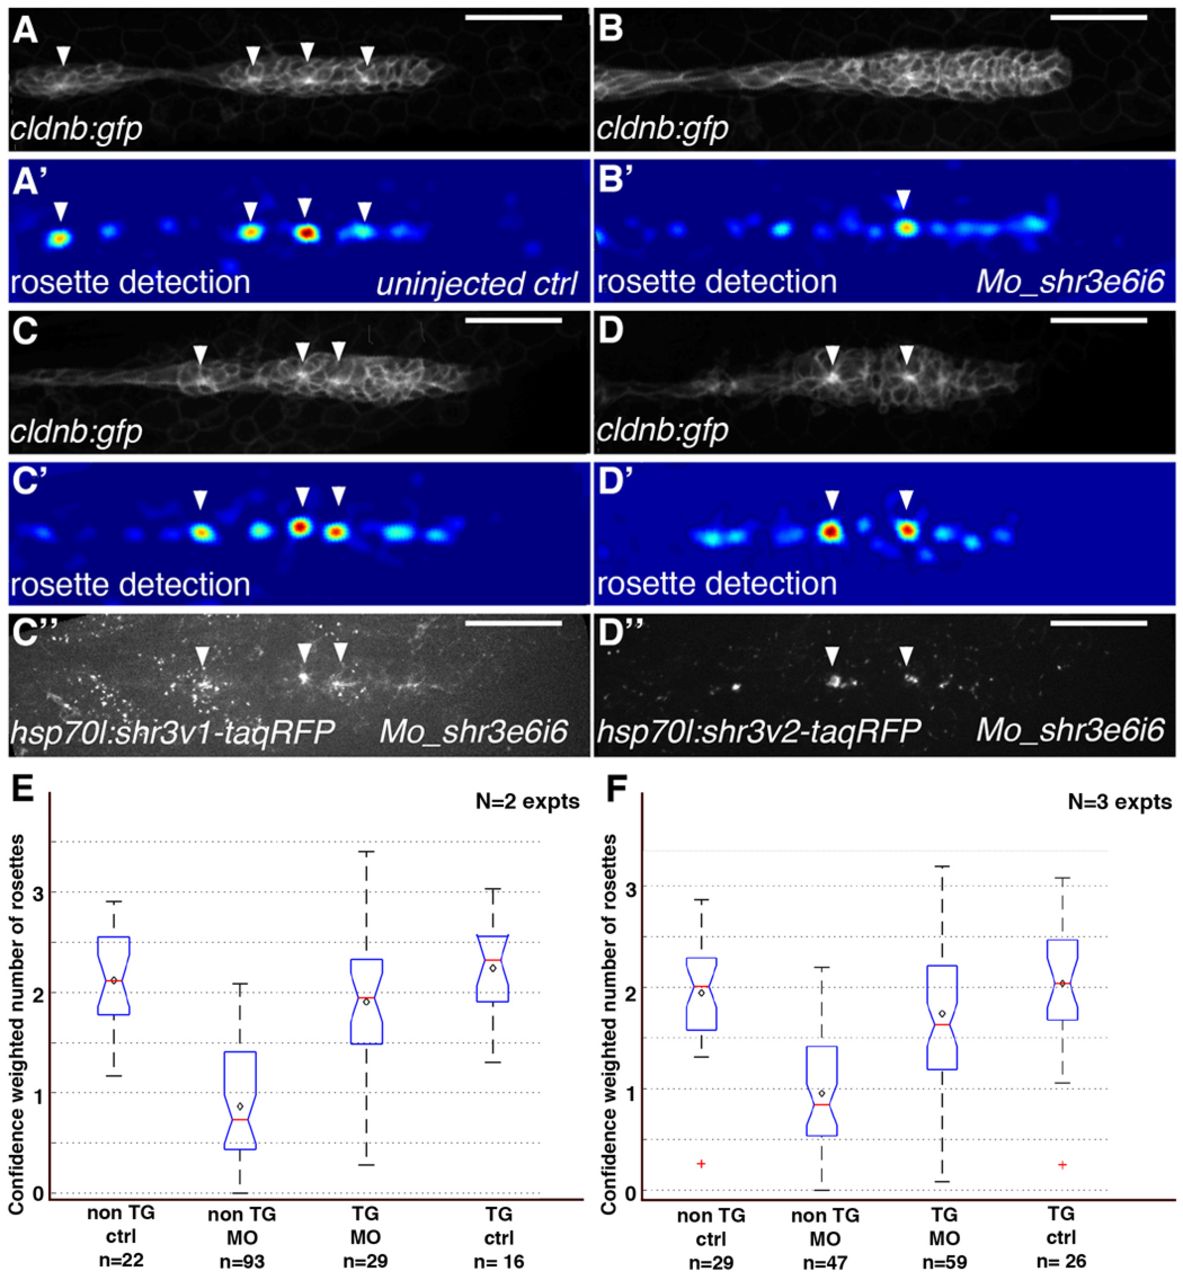
Fig. 4 Induction of shroom3 expression rescues rosette assembly in Mo_Shr3e6i6-injected zebrafish embryos. (A-D′′) Images of the pLLP in heat-shocked non-transgenic siblings (A-B′), hsp70l:shr3v1-tagRFP (C-C′′) or hsp70l:shr3v2-tagRFP (D-D′′) embryos injected with water (A,A′) or Mo_Shr3e6i6 (B-D′′). A′-D′ show the corresponding detection response images. Scale bars: 50 μm. (E,F) Boxplots displaying the results and statistics of confidence-weighted rosette numbers from the trained rosette detector (see Materials and methods). The red line and black diamond represent the median and mean value of each group, respectively. The edges of the box are the 25th and 75th percentiles. The black dashed line extends to the most extreme data points not considered to be outliers, and outliers are plotted individually as red plus signs. The medians of two groups are significantly different at the 5% significance level if their respective notch intervals do not overlap (interval end points represent the extremes of the notches). N is the number of independent experiments and n is the number of embryos per condition.