
|
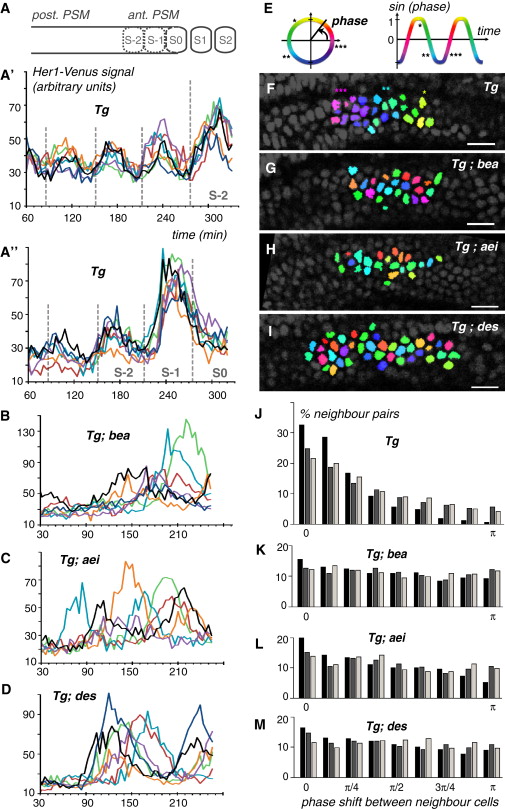
Fig. 3 Notch Signaling Is Required for Synchronous Oscillation in Neighboring PSM Cells(A-D) Reporter expression in six to seven neighbor cells tracked through time in wild-type (A′ and A′′), bea (B), aei (C), and des (D) embryos heterozygous for the Tg(her1:her1-Venus) transgene. Dashed gray lines in A2 and A3 indicate the time of somite boundary formation. The schematic drawing in (A) represents a lateral view of the PSM in a wild-type embryo (anterior to the right), showing newly formed (S1 and S2) and presumptive (S-2, S-1, and S0) somites.(E-I) Pseudo-coloration of cells based on the oscillation phase (E) at a single time point in wild-type (F), bea (G), aei (H), or des (I) mutant embryos.(J-M) Histograms of phase shift between all tracked neighbor cells at all time points for wild-type (J), bea (K), aei (L), and des (M) mutant embryos. Phase-shift distributions for three separate embryos (black, gray, and beige bars) are shown. A two-sample t test of wild-type embryos with each mutant indicates significant differences (two-tailed t test, ± = 0.05): WT versus aei (t = 40.02, p < 105), WT versus bea (t = 55.68, p < 105), and WT versus des (t = 53.13, p < 105).See also Figure S4 and Movies S2 and S3.
Reprinted from Developmental Cell, 23(5), Delaune, E.A., François, P., Shih, N.P., and Amacher, S.L., Single-cell-resolution imaging of the impact of notch signaling and mitosis on segmentation clock dynamics, 995-1005, Copyright (2012) with permission from Elsevier. Full text @ Dev. Cell