
|
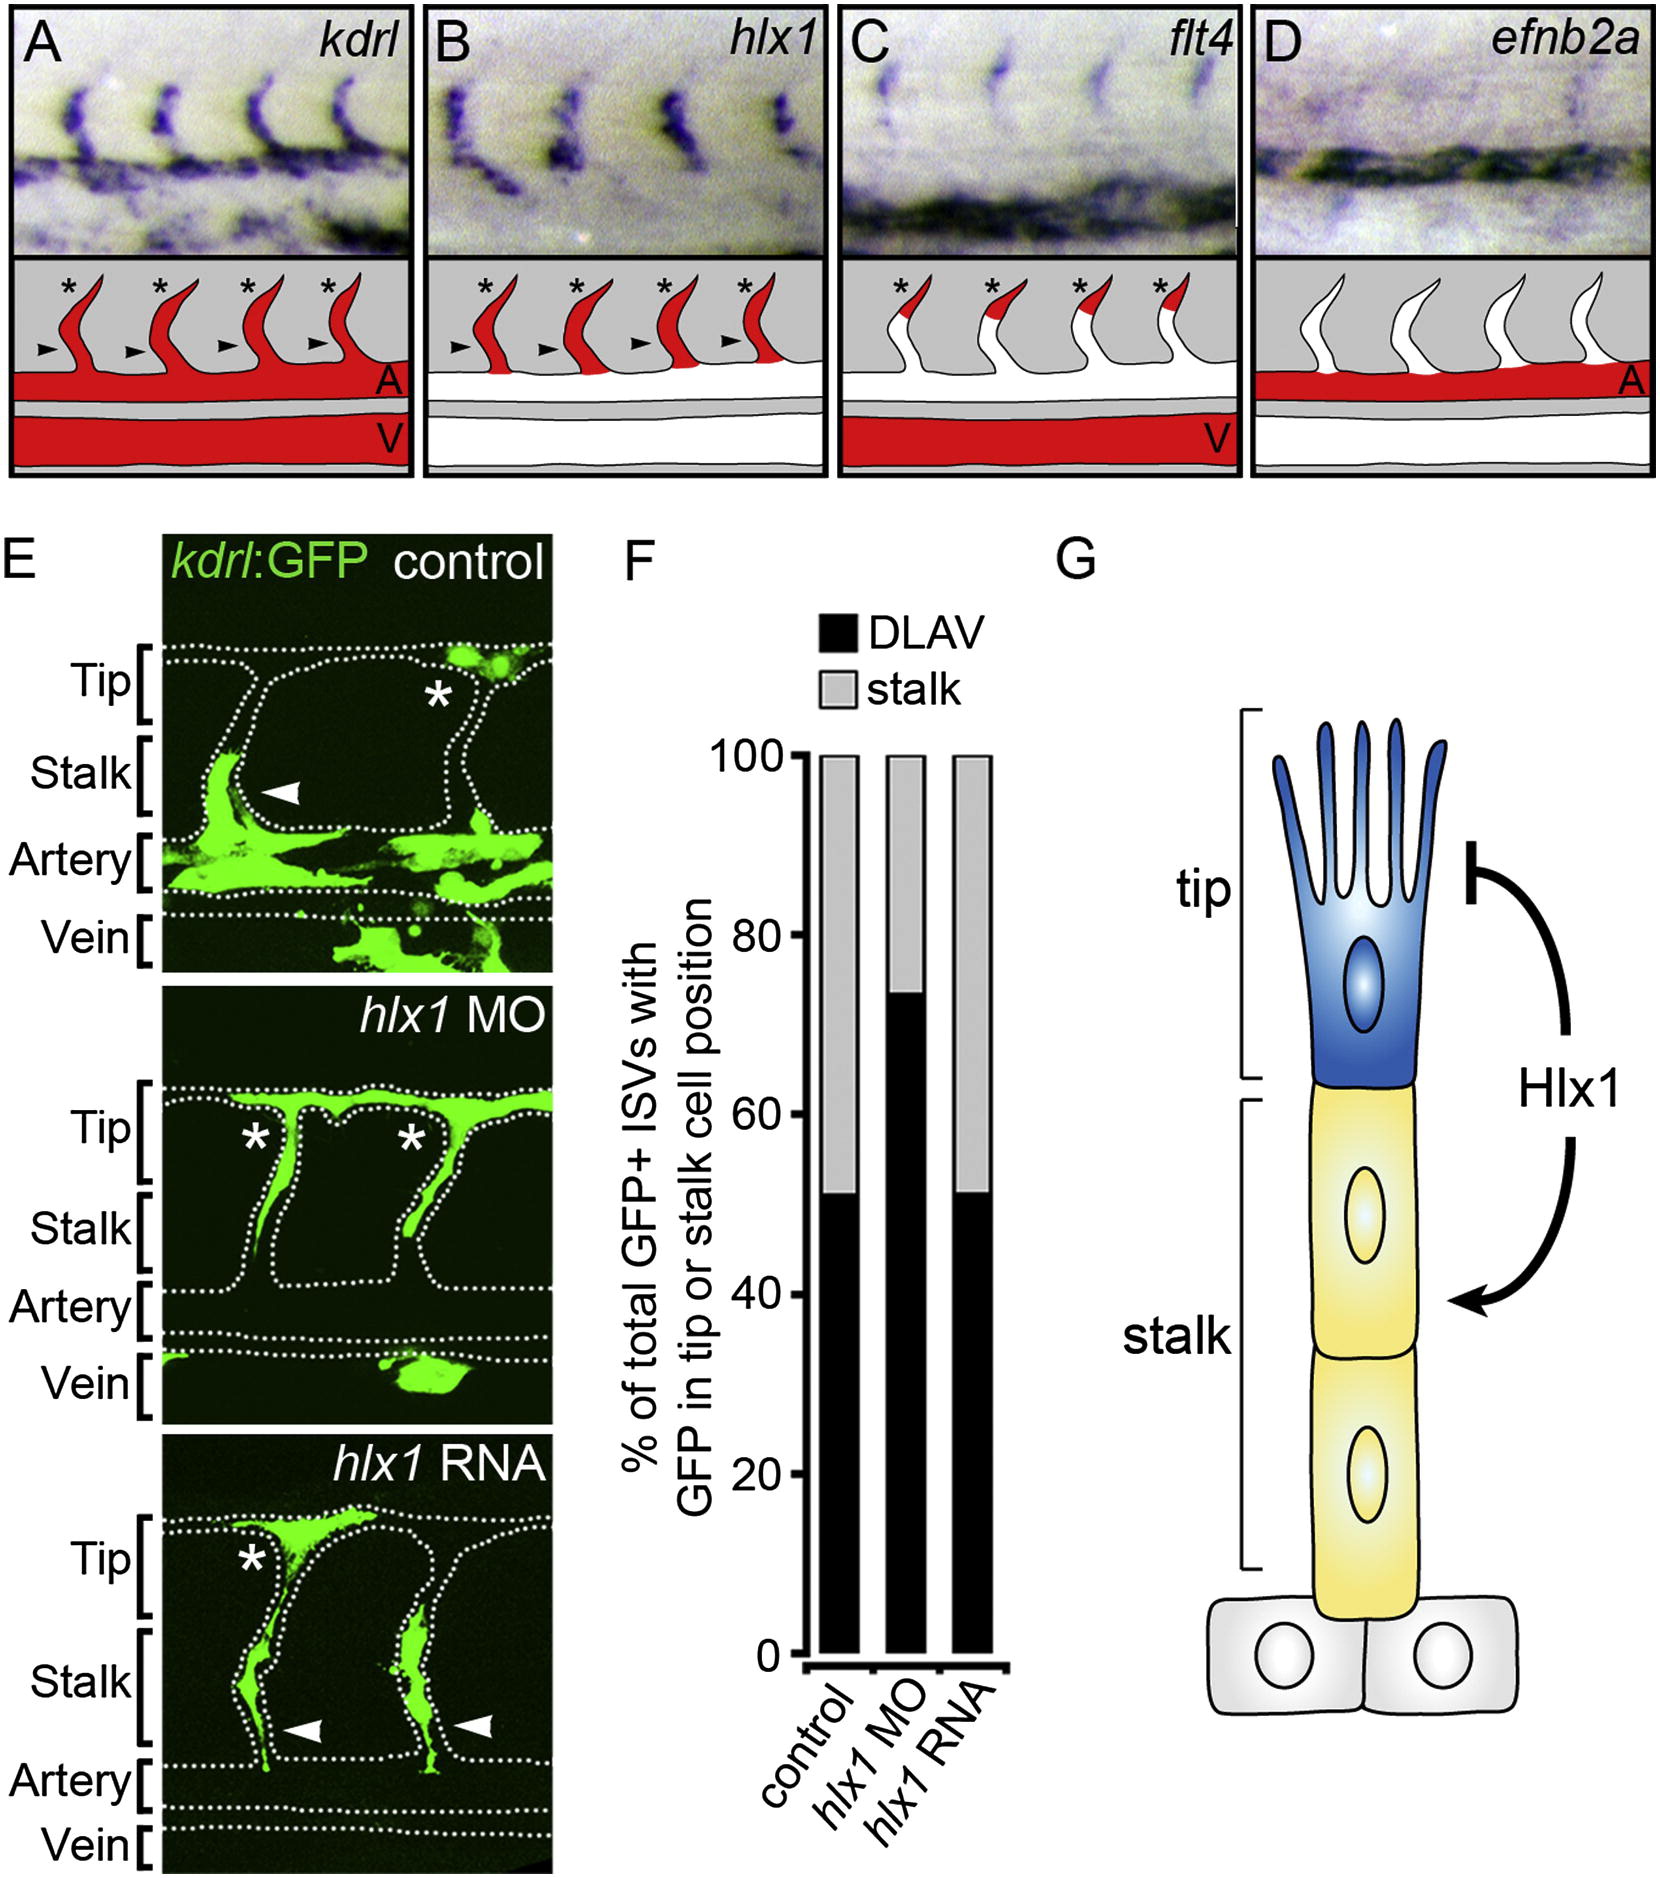
Fig. 4 Hlx1 Cell-Autonomously Maintains Endothelial SC Potential(A–D) Whole-mount in situ hybridization analysis of kdrl (A), hlx1 (B), flt4 (C), and efnb2a (D) at 30 hpf and diagrams displaying the expression domain of each gene (V, cardinal vein; A, DA; arrowhead indicates SC; asterisks denote TC). Whereas flt4 marks only TCs (C), hlx1 uniquely marks SCs (and possibly TCs) of the sprouting ISVs (B) and is excluded from nonangiogenic ECs of the DA, which express high levels of efnb2a (D).(E) Lateral images of control MO, hlx1 MO, or hlx1 RNA-injected donor Tg(kdrl:GFP)s843 cells in nontransgenic hosts at 30 hpf (dotted line represents position of the WT vasculature).(F) Quantification of the incorporation of donor cells into the DLAV position (asterisks in E) or stalk position (arrowheads in E) of individual host ISVs (n = at least 44 ISVs; control = 19 embryos; hlx1 MO, 17 embryos; hlx1 RNA, 26 embryos). When hlx1 is knocked down, ECs are lost from the ISV stalk position and accumulate in the DLAV position of sprouting ISVs.(G) Model summarizing the EC-autonomous function of Hlx1 during ISV angiogenesis.See also Figure S4, Movies S3 and S4, and Table S1.