
|
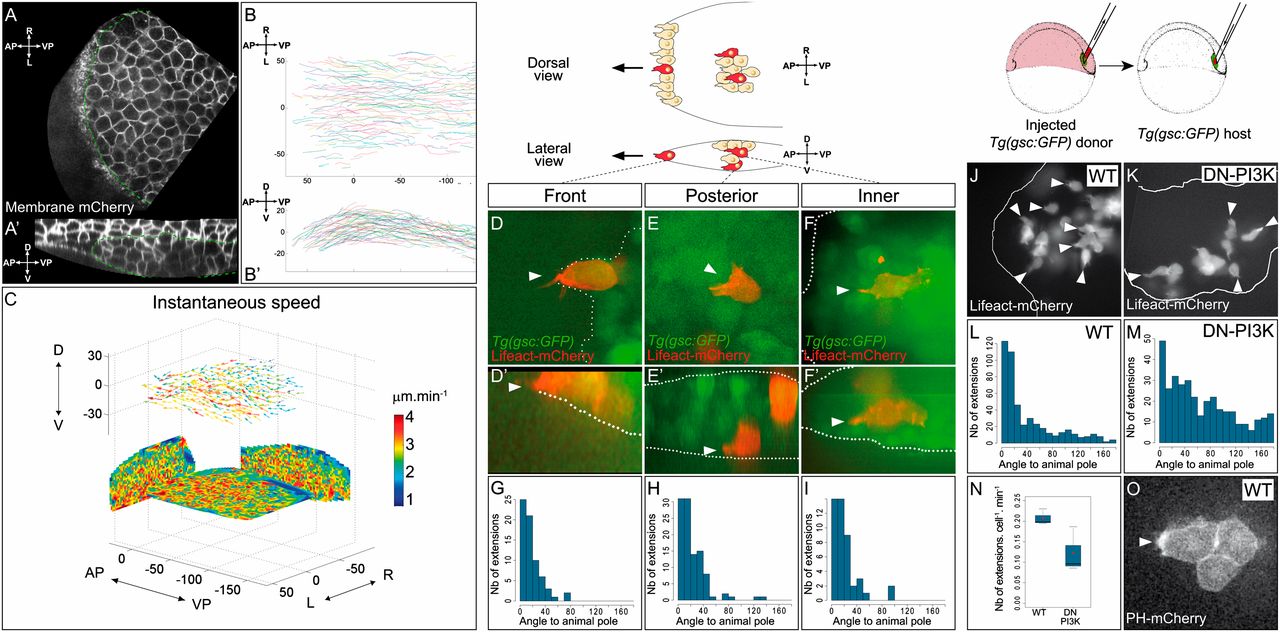
Fig. 1 All prechordal plate cells show similar migrating properties. (A) Dorsal (A) or reconstructed lateral view (A′) of a Tg(gsc:GFP) embryo injected with membrane mCherry RNAs. The green dashed line delineates the prechordal plate. (B) Tracks of prechordal plate nuclei in dorsal (B) or lateral (B′) view. One representative embryo, tracked for 18 min. (C) Field of instantaneous speed in the prechordal plate (Materials and Methods). Speed norm is color-coded. Two-dimensional projections on the three planes have been plotted. (D–I) Front (D, D′, and G), posterior (E, E′, and H), or inner (F, F′, and I) cells emit cytoplasmic extensions containing actin (D–F). Location of the cell is assessed by lateral view reconstruction (D′–F′). These extensions are oriented toward the animal pole (G–I). Angles between the axis of the extension and the direction of the animal pole are plotted as histograms, with “0” thus representing an extension pointing to the animal pole. (J–O) Control cells (J) or cells injected with the DN-PI3K (K) were transplanted from shield to shield. (L and M) Orientations of the cytoplasmic extensions relative to the animal pole. (N) Frequencies of cytoplasmic extensions. (O) PH-mCherry accumulation at the anterior pole of a cell within the plate [assessed by GFP expression, as the host embryo is Tg(gsc:GFP); green channel not displayed]. Animal pole is to the left.