
|
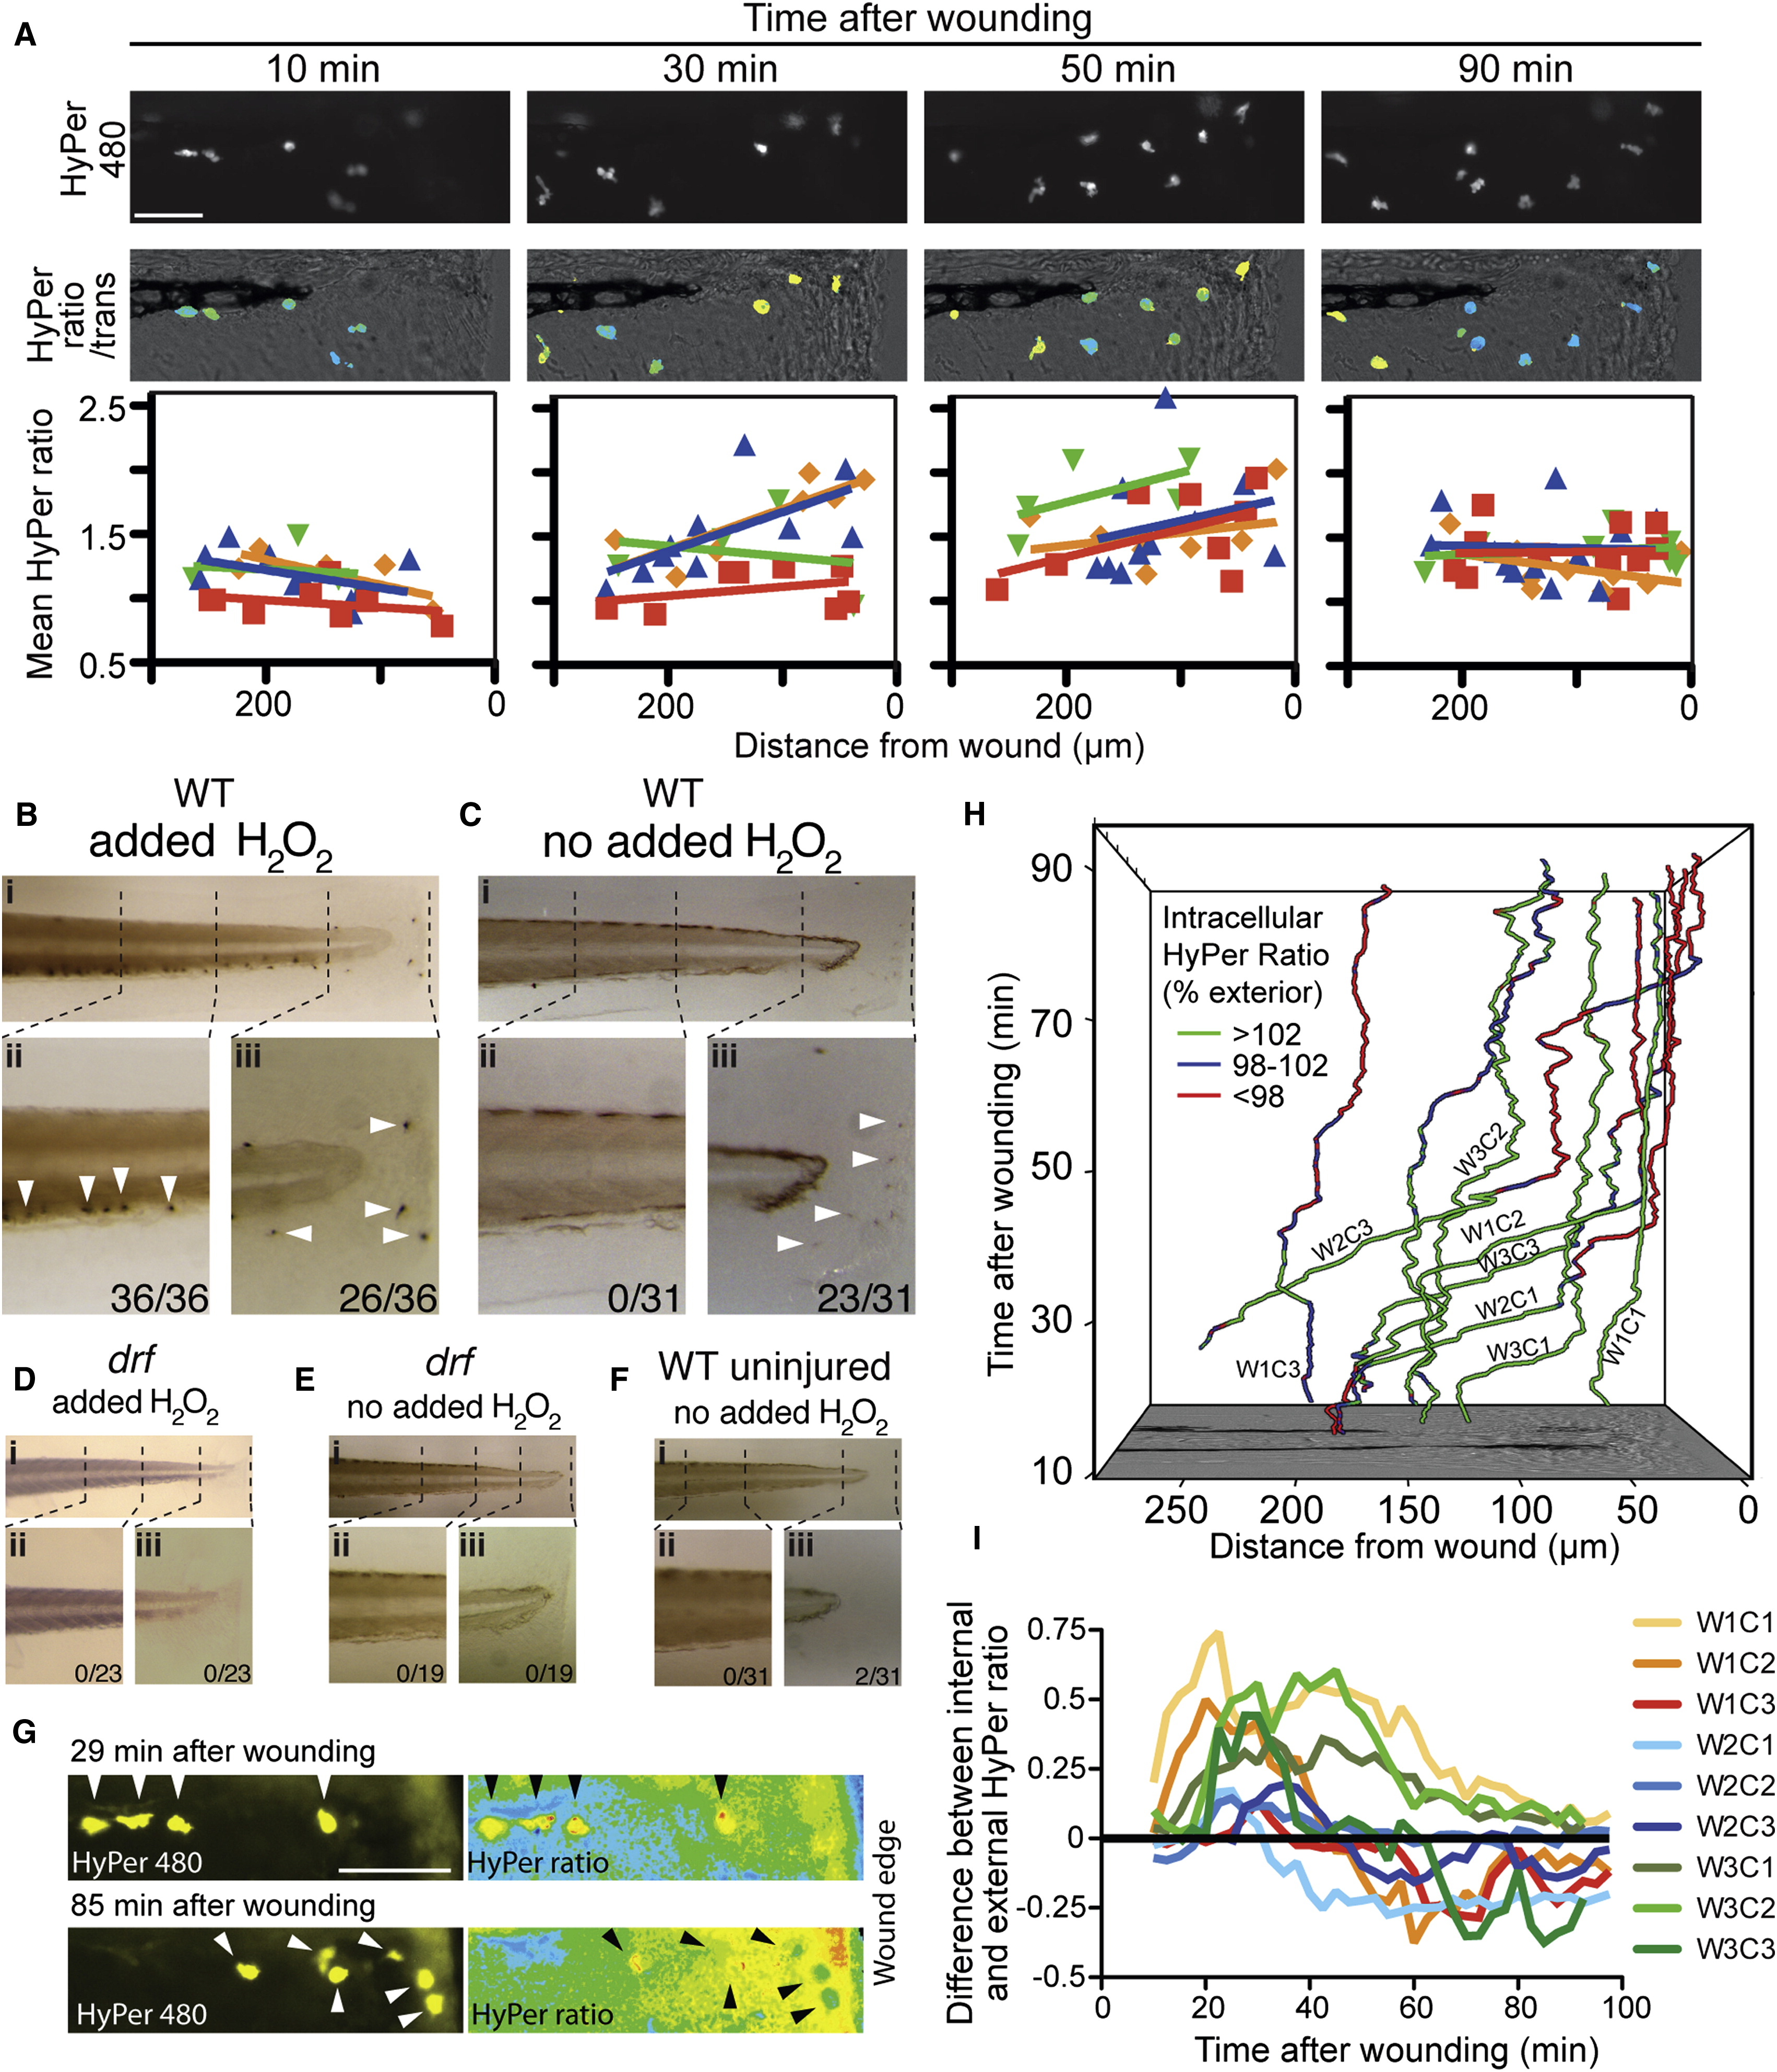
Fig. 4 Myeloperoxidase and H2O2 Interact Directly within Neutrophils at the Wound Zone(A) HyPer480 images showing neutrophil-specific HyPer expression in Tg(lyz:HyPer) embryos, with HyPer ratio heat maps reflecting the corresponding intraneutrophil [H2O2] levels at four time points after wounding. Stills from Movie S3. Corresponding graphs show single neutrophil mean HyPer ratios plotted against distance from wound for four individual embryos, with individual animal regression lines (individual animals color-coded). The negative gradient at 30–50 min after wounding contrasts with the uniform intraneutrophil [H2O2] levels prior and later, and indicates higher internal [H2O2] within wound-proximate neutrophils at these time points.(B–F) Demonstration of a direct enzymatic Mpx/H2O2 interaction within the wound zone by histochemical staining for Mpx activity. For each reaction condition (B–F), the three panels are (i) an overview, (ii) details of cells in the caudal hematopoietic tissue, and (iii) wound zone. Stained cells (white arrows) indicate Mpx-dependent catalysis of p-phenylenediamine and catechol. When H2O2 is supplied as a reagent, cells stain throughout the embryo (B), but without supplemented H2O2, cells stain only at the wound margin (C). (D)–(F) are negative controls: (D) and (E) drf controls show that staining is mpx-dependent regardless of the H2O2 source; (F) WT uninjured control showing that detecting staining of wound-proximate cells is injury-dependent. x/y n values are as follows: (embryos with e1 positive cell in region)/(embryos scored).(G–I) The relative [H2O2] within and surrounding wound zone neutrophils, demonstrated using HyPer-mRNA-loaded Tg(lyz:HyPer) embryos. (G) Groups of neutrophils 29 and 85 min after wounding displayed by their HyPer480 signal, with corresponding HyPer ratio images portraying intra- and extracellular [H2O2]. At 29 min, all neutrophils have higher [H2O2] internally than externally, but at 85 min, a cluster of 3 neutrophils displays lower [H2O2] internally than externally. Stills from Movie S4 are shown. (H) Tracks of nine neutrophils plotted in space (x,y) and time (z), with tracks colored in categories to indicate when the neutrophil internal [H2O2] exceeds (green), equals (blue), or is less than (red) the external [H2O2]. Legend gives percentage of exterior HyPer ratio category cut-offs. The nine cells are three neutrophils (C1-3) selected from three wounded embryos (W1–W3). (I) The difference between internal and external [H2O2] in time for these same nine cells expressed as the difference between internal and external mean HyPer ratios. Six out of nine cells in (H, I) are net [H2O2] consumers, and in 5/6 cases this phenotype is accentuated as they approach the wound margin (one cell does not migrate). Scale bars in (A) and (G) represent 50 μm. Unlabelled perspective-shortened y axis marks (H, left upper corner) indicate 50 μm steps.