
|
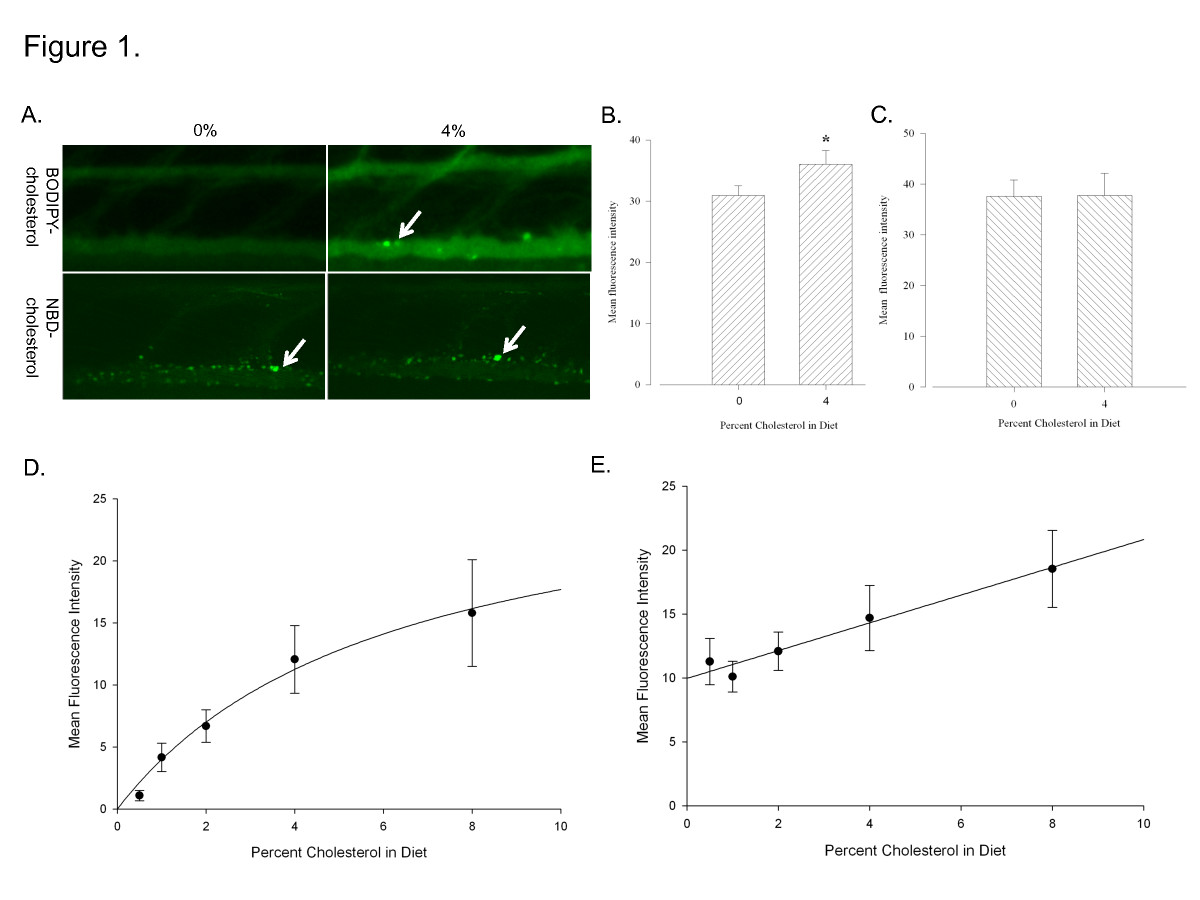
Fig. 1 BODIPY-cholesterol (BOD-CH) vs. NBD-cholesterol (NBD-CH). A. Green is BOD-CH and NBD-CH fluorescence. Arrows point to fluorescent deposits in vasculature. Top panel: 0% HCD + 10 μg/g BOD-CH vs. 4% HCD + 10 μg/g BOD-CH. Bottom panel: 0% HCD + 10 μg/g NBD-CH vs. 4% HCD + 10 μg/g NBD-CH B. 0% HCD + 10 μg/g BODIPY-CH shows significantly less fluorescent output than 4% HCD + 10 μg/g BOD-CH (*P < 0.05, Student′s t-test. n = 12 in each group) C. 4% HCD + 10 μg/g NBD-CH is not different from 0% HCD + 10 μg/g NBD-CH D. Dose response: BOD-CH fluorescence vs. percent cholesterol in diet. 0.5-8% HCD + 5-80μg/g BOD-CH (R = 0.912, R2 = 0.83). 1-way ANOVA with Holm-Sidak multiple comparison indicates statistically significant difference between each group and every other group (P < 0.05, n = 11-12 in each group) E. Dose response: NBD-CH fluorescence vs. percent cholesterol in diet (R = 0.811, R2 = 0.657). Each group is significantly different from all others (P < 0.05, 1-way ANOVA, Holm-Sidak multiple comparison. n = 10-12 in each group) except 0.5, 1 and 2% which are not significantly different from each other in any combination.