
|
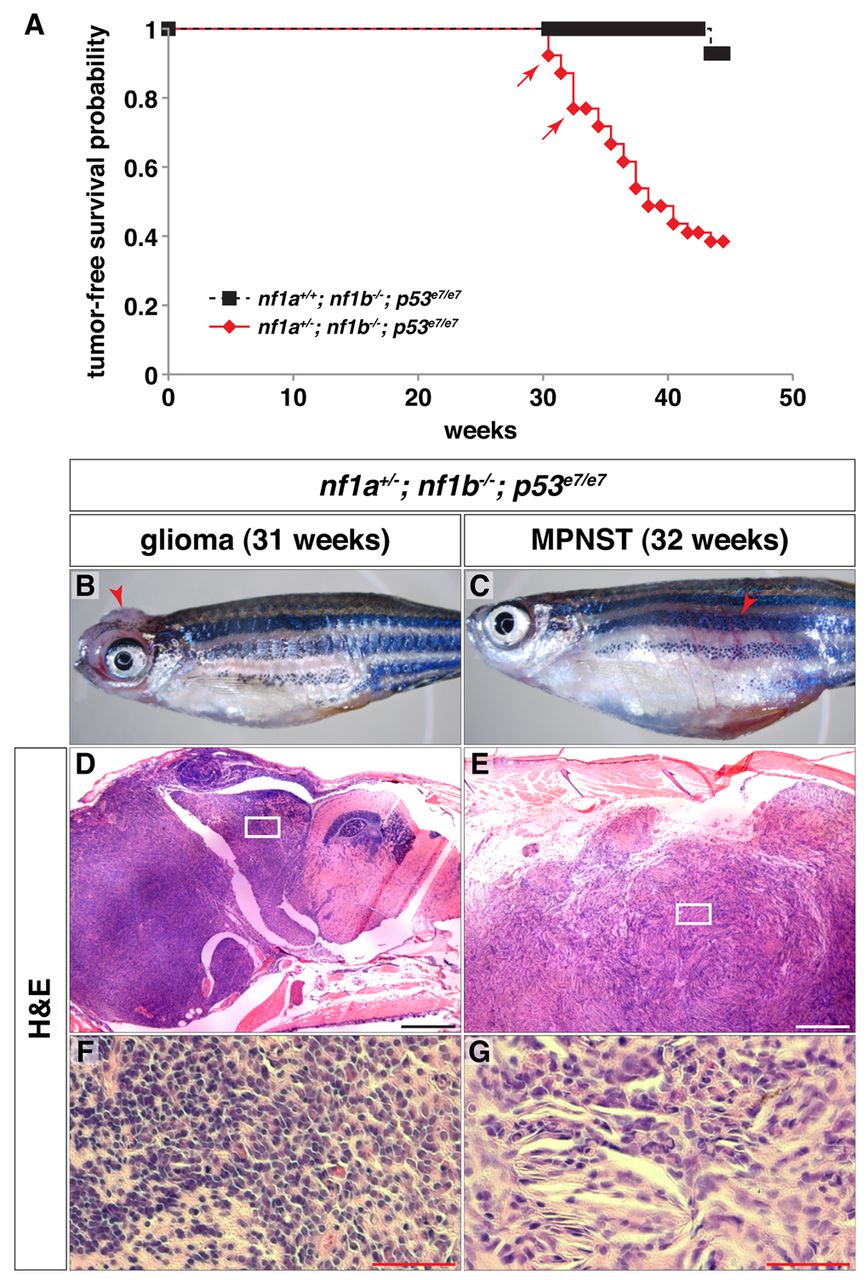
Fig. 6 nf1a/nf1b mutants demonstrate increased susceptibility to tumorigenesis in a p53 mutant background. (A) Kaplan-Meier tumor-free survival analysis for nf1a+/-; nf1b-/-; p53e7/e7 (n=39) animals demonstrates significantly decreased survival as compared with nf1a+/+; nf1b-/-; p53e7/e7 (n=14) animals (P<0.001). Arrows indicate ages at which animals were identified with brain tumors demonstrating features of diffuse high-grade gliomas. (B,C) 31-week-old nf1a+/-; nf1b-/-; p53e7/e7 animal with a high-grade glioma (B, arrowhead) and 32-week-old nf1a+/-; nf1b-/-; p53e7/e7 animal with a malignant peripheral nerve sheath tumor (MPNST) (C, arrowhead). (D-G) H&E staining of sagittal sections through the high-grade optic glioma (D, boxed area magnified in F) or MPNST (E, boxed area magnified in G). Scale bars: 200 μm (D,E) and 50 μm (F,G).