
|
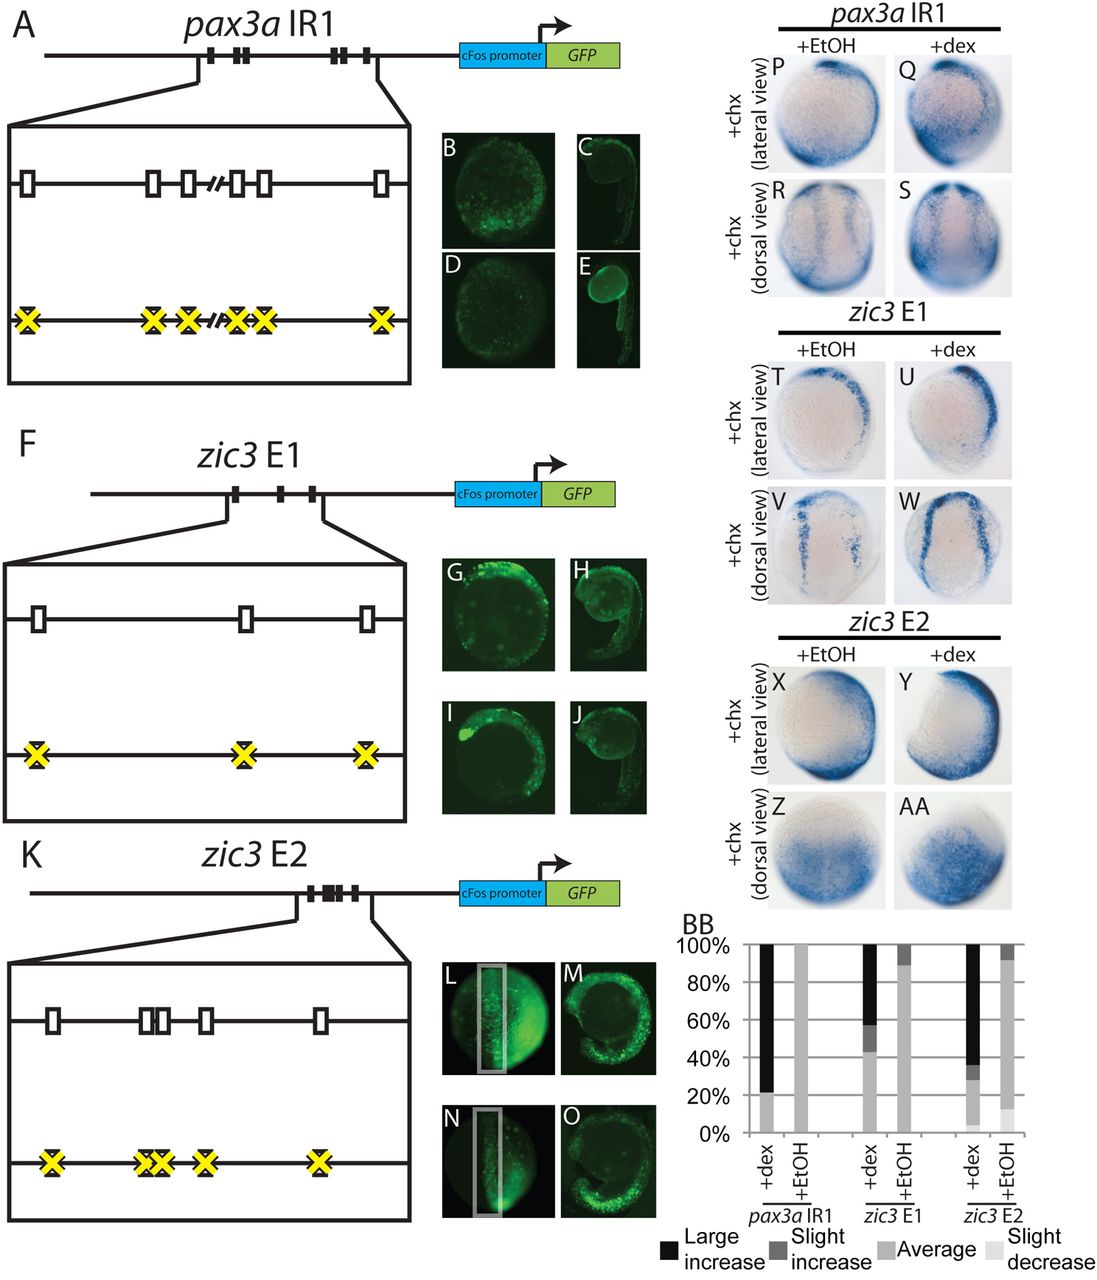
Fig. 8 pax3a IR1 and zic3 E1 and E2 are probably direct targets of canonical Wnt signaling. (A-E) Mutating six putative Tcf/Lef-binding sites from pax3a IR1 (rectangles in A) decreases enhancer activity at 12 hpf (92%, n=36) (D versus B) and 24 hpf (100%, n=32) (E versus C). (F-J) Mutating three putative Tcf/Lef-binding sites (rectangles, F) does not affect zic3 E1 activity at 12 hpf (89%, 16 out of 18 with wild-type GFP levels) (I versus G) and 24 hpf (61%, 11 of 18 with wild-type GFP levels) (J versus H). (K-O) Mutating five putative Tcf/Lef-binding sites (rectangles, K) reduces zic3 E2 activity in the NPB at 12 hpf (87%, n=20) (N versus L) and the dorsal neural tube at 24 hpf (100%, n=40) (O versus M). (P-AA) Embryos containing pax3a IR1:GFP, zic3 E1:GFP or zic3 E2:GFP were injected with GR-Lef1-βcat mRNA. The activity of all three enhancers significantly increases with dexamethasone and cycloheximide treatment relative to ethanol and cycloheximide treatment [pax3a IR1, Q,S versus P,R (69%, P=7x10⁷, n=16); zic3 E1, U,W versus T,V (57%, P=0.007, n=14); zic3 E2, Y,AA versus X,Z (73%, P=5×10⁹, n=37)]. (BB) The distribution of GFP staining levels in embryos injected with GR-Lef1-βcat mRNA and treated with cycloheximide and dexamethasone or ethanol is shown for each enhancer. B-E,G-J,M,O,P,Q,T,U,X,Y are lateral views with dorsal towards the right; L,N,Z,AA are anterior-dorsal views with anterior upwards; R,S,V,W are dorsal trunk views with anterior upwards.