
|
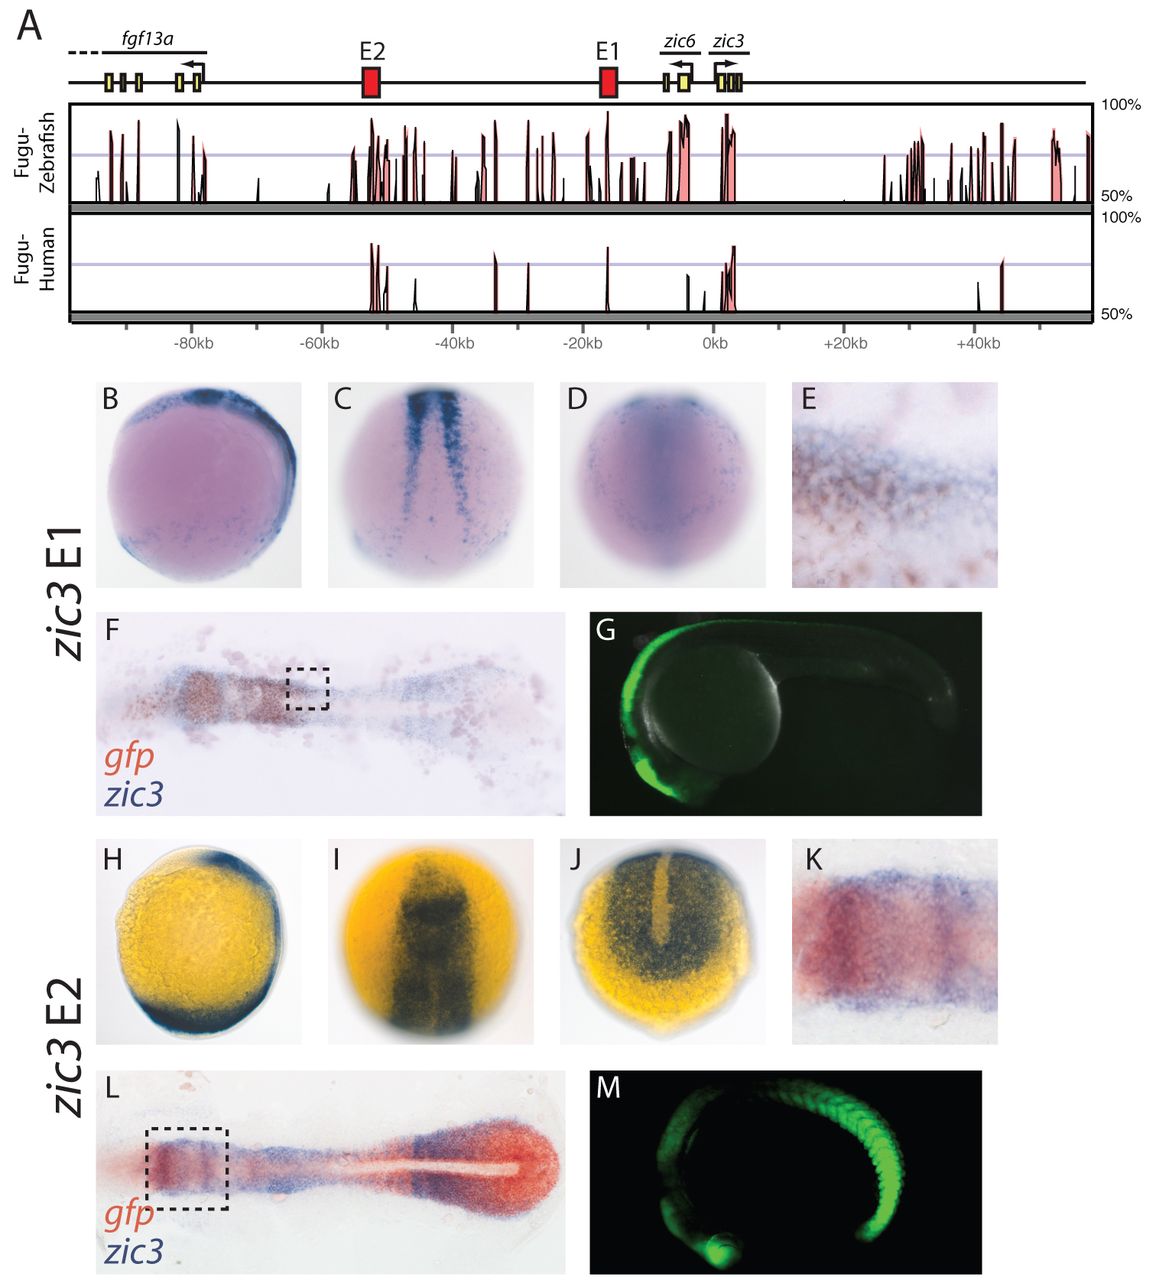
Fig. 6 Two zic3 enhancers drive gene expression in the NPB and dorsal neural tube. (A) The Fugu zic3/zic6 locus is shown along with a Vista plot of the level of sequence identity between Fugu, zebrafish and human zic3 loci. Enhancers are shown in red and exons are shown in yellow. (B-M) GFP expression driven by E1 (B-G) and E2 (H-M) is shown as detected by in situ hybridization for embryos at 12 hpf (B-F,H-L) and by GFP fluorescence at 24 hpf (G,M). Double in situ hybridization for GFP (brown) and zic3 (purple) demonstrate that zic3 expression overlaps with the activity of E1 and E2 (E,F,K,L). E,K are higher magnification views of the areas outlined in F,L, respectively. B,H,G,M are lateral views; D,J are posterior dorsal views; C is a trunk dorsal view; I is an anterior dorsal view.