
|
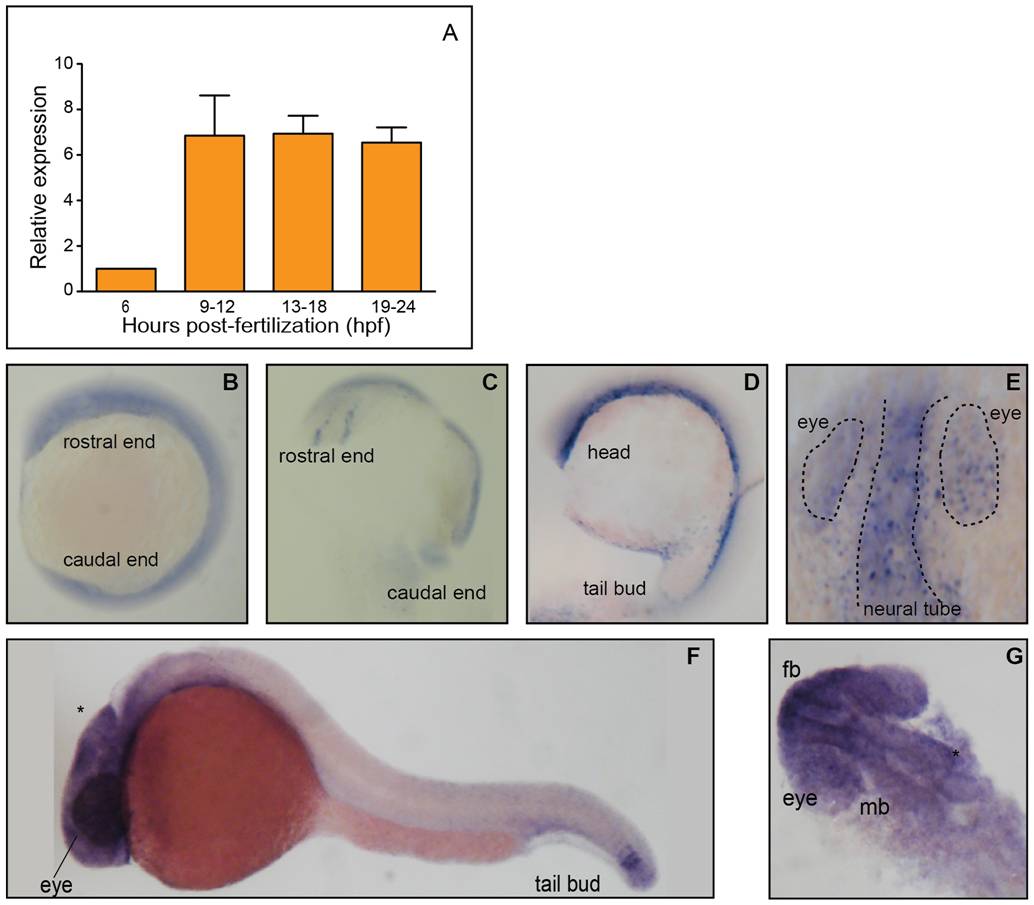
Fig. 2 TTP expression is dynamic in the developing zebrafish.
A. Embryonic TTP transcription increases during the first 24 hpf. Expression normalized to odc1 expression, and values are expressed as fold change compared to 6 hpf. Data shown as mean ± SEM, 6 hpf n = 4, 9–12 n = 6, 13–18 n = 9, and 19–24 n = 11 replicates (30 embryos per replicate). B-G. Whole mount in situ hybridization of ttpa reveals the patterning of mRNA expression. B. A lateral view of a whole mount embryo at 12 hpf shows fairly even distribution, however, in C a dorsal view of the rostral region with the yolk removed shows specific staining along what may be the developing neural tube. D. At 17 hpf expression remains along the length of the embryo, concentrating in the deeper cells, closer to the yolk sac. E. A dorsal view of the developing head at 17 hpf, the eyes and neural tube is where the expression appears to be localized (outlined). F. By 24 hpf the staining is seen only in the regions of the developing brain, eyes and tail bud. G. Dorsal view depicts brain and eye specific patterning. Yolk sacs were manually removed to reduce color interference, and for ease of positioning. fb = forebrain, mb = midbrain, * = midbrain-hindbrain boundary.