
|
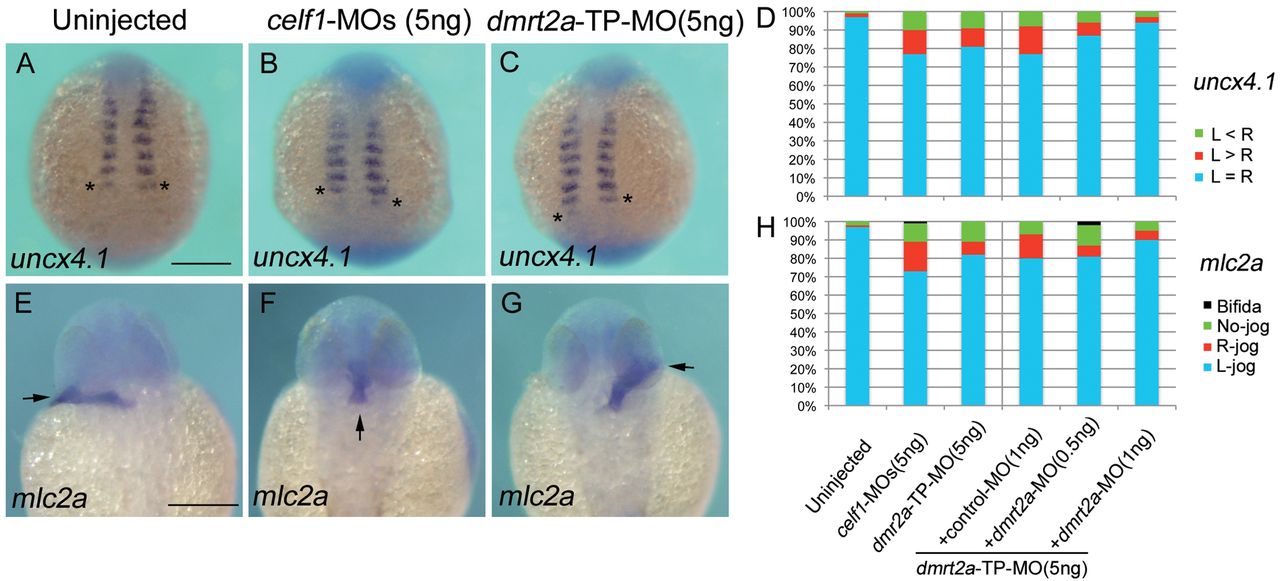
Fig. 3 Knockdown of celf1 leads to defects in somite symmetry and LR patterning. (A-C) Representative images of uncx4.1 expression demonstrating symmetric (uninjected; A), right-biased (celf1-MOs; B) or left-biased (dmrt2a-TP-MO; C) asymmetric somitogenesis in zebrafish embryos at 12-14 hpf. Dorsal view, anterior to the top. Asterisks mark the last-formed somite. (D) Percentages of symmetric (L=R), left-biased (L>R) or right-biased (L<R) asymmetric somitogenesis in embryos injected with 5 ng control-MO (n=121), 5 ng celf1-MOs (n=102), 5 ng dmrt2a-TP-MO (n=90), 5 ng dmrt2a-TP-MO plus 1 ng control-MO (n=40), 5 ng dmrt2a-TP-MO plus 0.5 ng dmrt2a-MO (n=60) or 5 ng dmrt2a-TP-MO plus 1 ng dmrt2a-MO (n=68). (E-G) Representative images of mlc2a expression showing L-jog (uninjected; E), no-jog (celf1-MOs; F) or R-jog (dmrt2a-TP-MO; G) of the heart in embryos at 24-28 hpf. Dorsal view, anterior to the top. Arrows indicate the direction of heart jogging. (H) Percentages of L-jog, R-jog, no-jog or cardia bifida of the heart in embryos injected with 5 ng control-MO (n=152), 5 ng celf1-MOs (n=90), 5 ng dmrt2a-TP-MO (n=76), 5 ng dmrt2a-TP-MO plus 1 ng control-MO (n=46), 5 ng dmrt2a-TP-MO plus 0.5 ng dmrt2a-MO (n=47) or 5 ng dmrt2a-TP-MO plus 1 ng dmrt2a-MO (n=46). Scale bars: 200 μm.