
|
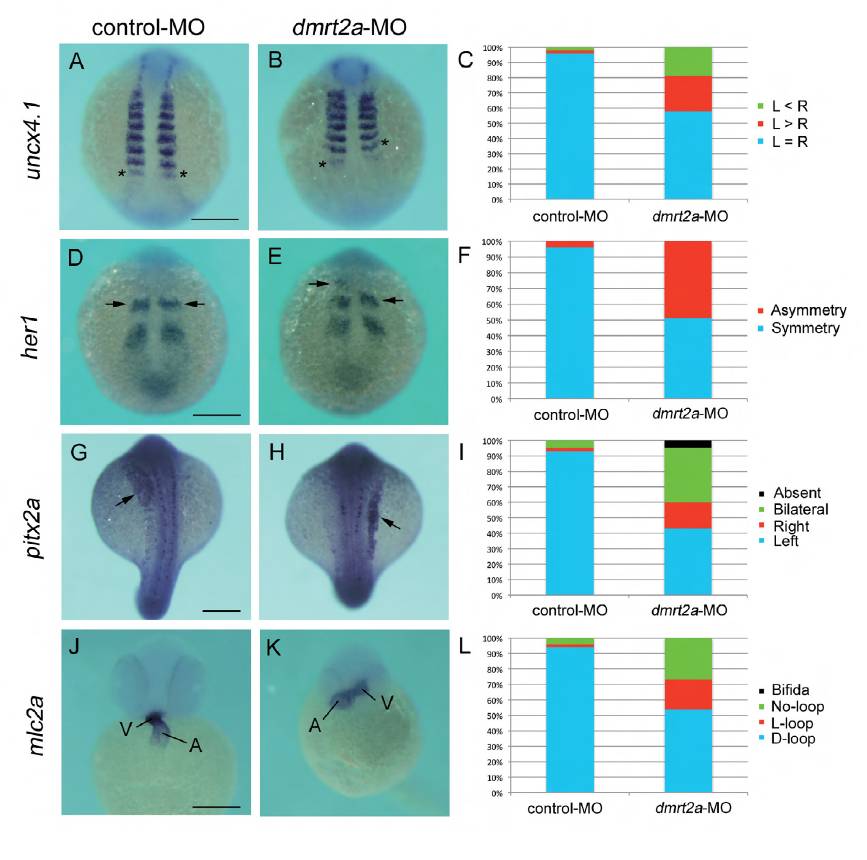
Fig. S2 Knockdown of dmrt2a yields defects similar to those seen in celf1-overexpressing embryos. (A,B,D,E,G,H,J,K) In situ hybridization for uncx4.1 (A,B), her1 (D,E), pitx2a (G,H) or mlc2a (J,K) in control- MO-injected (A,D,G,J) or dmrt2a-MO-injected (B,E,H,K) embryos. Asterisks in A and B mark the last-formed somite. Arrows in D, F, G and H indicate the position of the anterior strip of her1 and pitx2a expression in the lateral plate mesoderm, respectively. A, atrium; V, ventricle. Scale bar: 200 μm. (C) Percentages of symmetric (L=R), left-biased (L>R) or right-biased (L<R) asymmetric somitogenesis in embryos injected with control- MO (n=44) or dmrt2a-MO (n=53). (F) Percentages of symmetric and asymmetric her1 oscillation in embryos injected with control-MO (n=48) or dmrt2a-MO (n=51). (I) Percentages of left-sided, right-sided, bilateral, or no (absent) expression of pitx2a in embryos injected with control-MO (n=59) or dmrt2a-MO (n=46). (L) Percentages of D-loop, L-loop, no-loop or cardia bifida of the heart in embryos injected with control-MO (n=58) or dmrt2a-MO (n=78).