
|
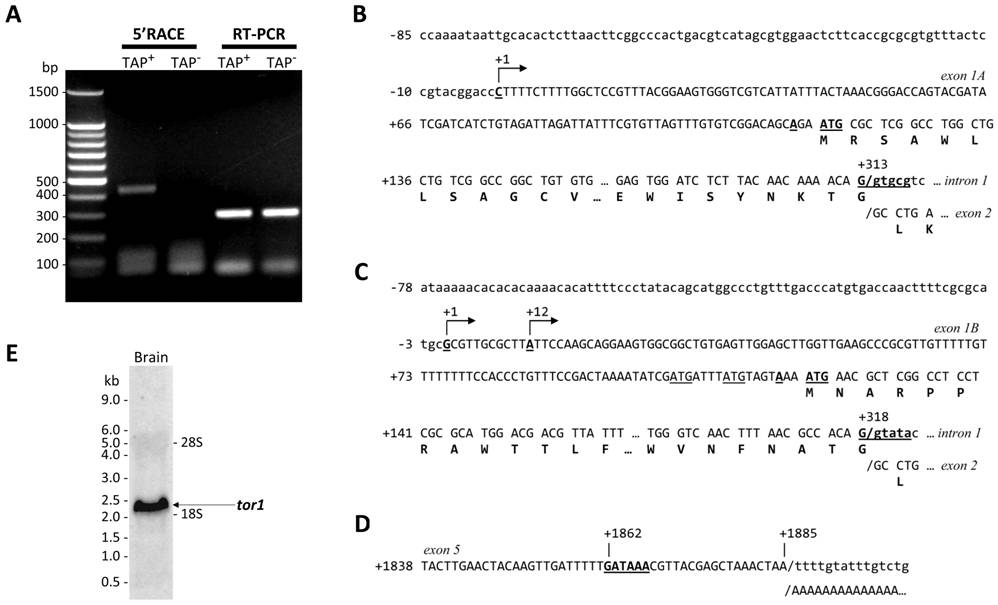
Fig. 4 tor1 promoters and transcripts.
A: Zebrafish brain total RNA was treated with tobacco acid pyrophosphatase (TAP+; lanes 2 and 4) or untreated (TAP; lanes 3 and 5) prior to RACE adapter ligation and reverse transcription. tor1 was amplified by 5′RACE using a tor1 exon 2 reverse primer and a RACE adapter primer (lanes 2 and 3) or by RT-PCR using tor1 primers (lanes 4 and 5). B, C: The transcriptional start sites of tor1_tv1 (B) and tor1_tv2 (C) were determined by comparing the genomic sequence with sequences of the 5′ RACE products shown in panel A. The transcriptional start sites are shown underlined with arrows; bases are numbered such that +1 represents the first nucleotide of the most 5′ transcriptional start site. The open reading frames of exons 1A and 1B and their 3′ splice sites are shown. The consensus ANNAUG< translational initiation signals are indicated in bold and underlined; non-consensus AUG sequences in the 5′UTR of tor1_tv2 are underlined. D: 3′RACE was employed to determine the 3′ terminus of the transcript. The polyadenylation signal within exon 5 is underlined in bold. The position of the poly(A) tail in the mRNA is indicated. E: Brain total RNA was separated electrophoretically and the resulting northern blot was probed using a cRNA probe to tor1. The positions of molecular size standards and the 28S and 18S rRNA bands are shown.