
|
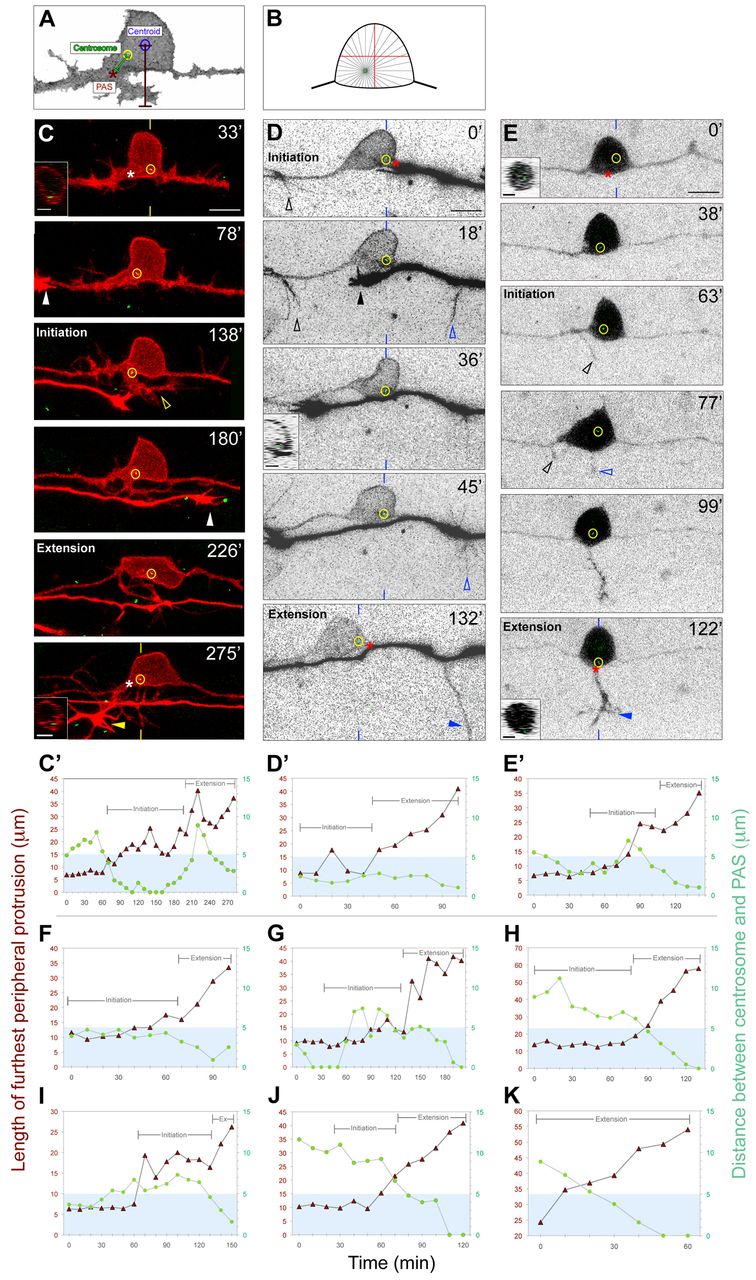
Fig. 3 The centrosome localizes near the RB PAS during axon formation. (A) Schematic showing how centrosome localization and peripheral axon length were measured for the plots in C2-E2 and F-K (see Materials and methods). (B) Diagram showing how off-center displacement of the centrosome could cause asymmetric microtubule (MT) delivery. (C-E) Individual RB neurons labeled by transient expression of either TagRFP-CAAX in GFP-Xcentrin mRNA-expressing zebrafish embryos (C,D) or of GFP-Zcentrin (E) alone. Dorsal-lateral views, anterior left. Images are z-projections of RB neuron (red or black-white inverted) overlaid with single xy planes (green) of the centrosome (yellow circles). Insets are optical cross-sections (medial is left) through the region of the cell containing the centrosome (indicated with yellow or blue hatch marks). (C2-E2,F-K) Plots of length of furthest peripheral protrusion (red triangles) and centrosome distance to PAS (green circles) versus time during peripheral axon initiation and extension (brackets). Blue box indicates region within 5 µm of the PAS. (C,C2) Time-lapse images and corresponding plot showing centrosome localization to the PAS during peripheral axon initiation (open arrowhead) and extension. Asterisks at 33′ and 275′ indicate future and formed PAS. White and yellow arrowheads at 782 and 275′ indicate growth cones of neighboring central and peripheral axons entering the field of view. (D,D′) Time-lapse images and corresponding plot showing centrosome localization near the PAS during initiation and extension. A peripheral axon initiates off the ascending central axon (black open arrowhead), but retracts after a second peripheral initiates off the descending central axon (blue open arrowhead) and extends (blue arrowhead). Asterisks at 0′ and 132′ indicate position measured for PAS. Black arrowhead at 18′ indicates growth cone of neighboring central axon. (E,E′) Time-lapse images and corresponding plot showing centrosome localization to the PAS during peripheral axon initiation and extension. A peripheral axon initiates off the ascending central axon (black open arrowheads), but retracts after a second peripheral axon initiates off the cell body (blue open arrowhead) and extends into the periphery (blue arrowhead). Asterisks at 0′ and 122′ indicate future and formed PAS, respectively. Time is in minutes. Plots in F-K are from six additional movies. Scale bars: 10 μm; 5 μm in insets.