
|
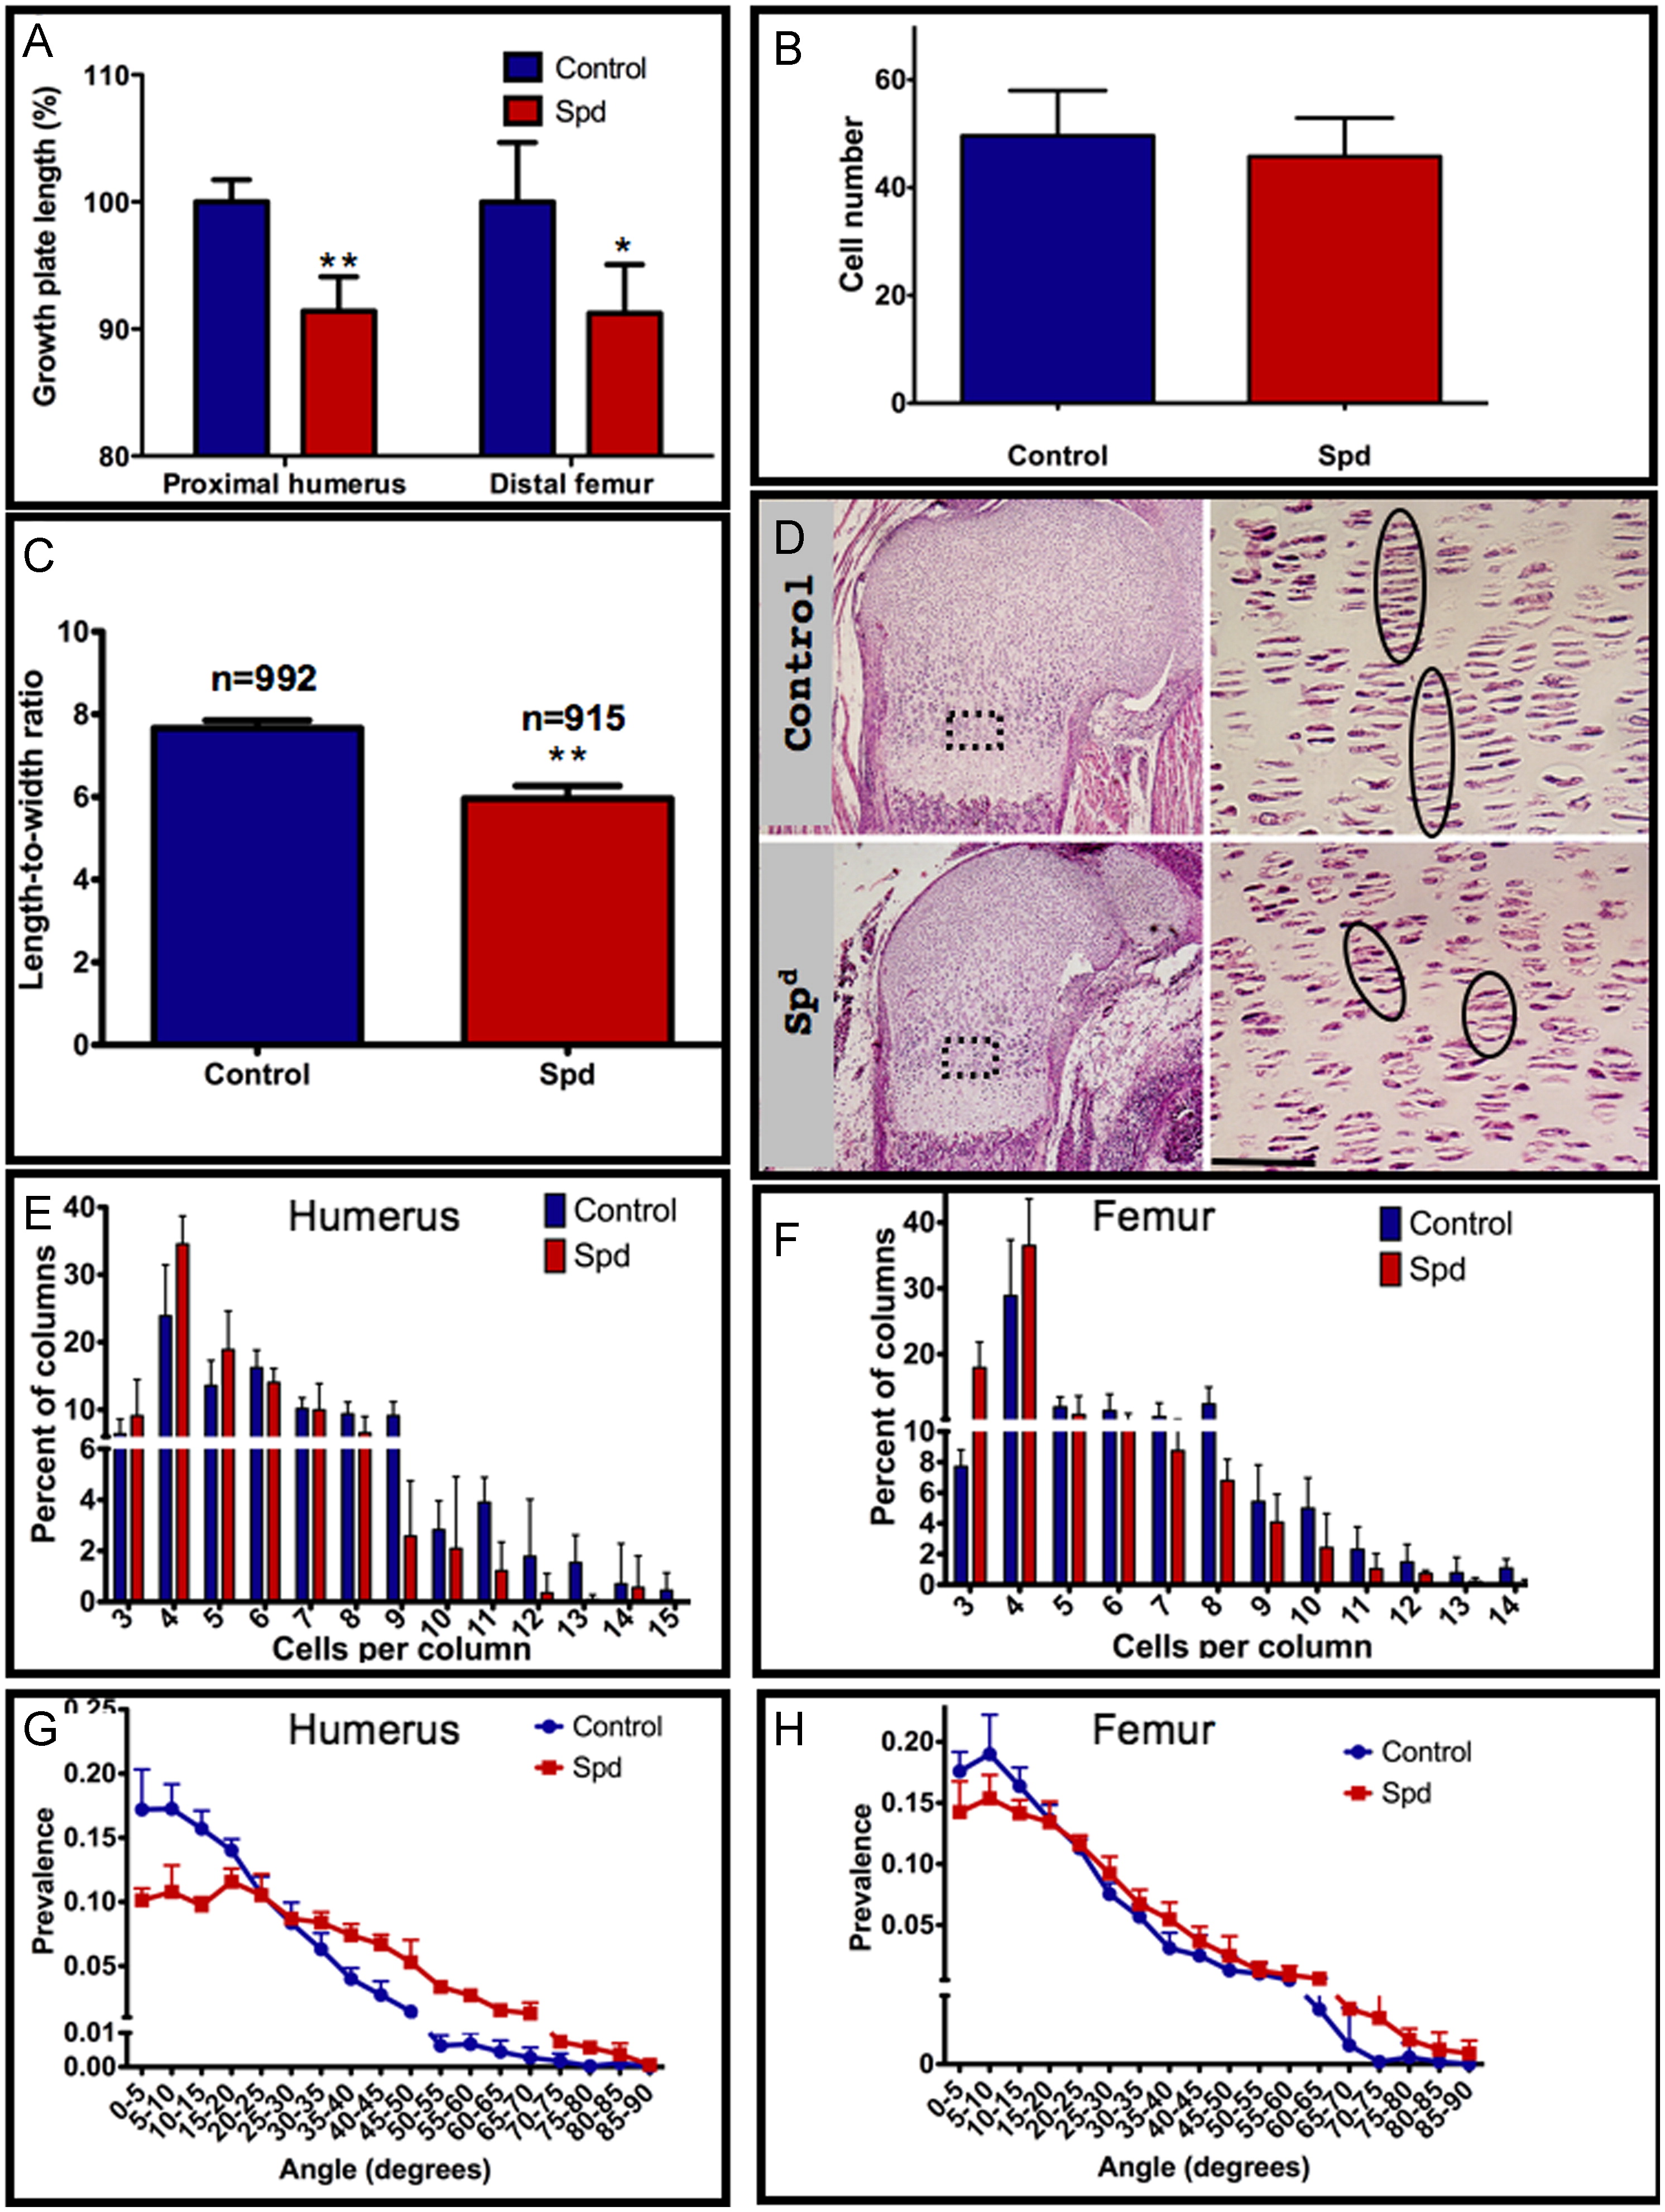
Fig. 5 Muscle contraction affects chondrocyte intercalation in mice. (A) Length measurements of humeral and femoral growth plates in control and Spd mutant (humerus: p=0.0017; femur: p=0.027). (B) Quantification of cell number per constant area in control and Spd embryos (p=0.1266). An area of 8732.73 μm2, corresponding to the boxed area in (D) in the humerus growth plate was used for calculation; 4–7 sections from each embryo were analyzed. (C) Quantification of the mean length-to-width ratio of chondrocytes from control and Spd humeral growth plates (F15.5=71.07, p=0.0002). (D) H&E staining of control (upper panel) and Spd (lower panel) humeral growth plates; magnification of the boxed areas is shown on the right. Circles highlight the columnar organization of chondrocytes. (E, F) Comparison of chondrocyte column lengths between control and Spd embryos: Distribution of columns by number of cells per column in the humerus (E; X12=13.093, p=0.0003) and femur (F; X12=14.192, p=0.00017). (G, H) Distribution of angles between adjacent columns in control and Spd mutant in the humerus (G) and femur (H). Both distributions were found to be significantly different (see Table 1 and Table 2). Measurements were made on 4–5 controls and 4–5 mutant embryos from 3–4 different litters; scale bar represents 50 μm.
Reprinted from Developmental Biology, 370(1), Shwartz, Y., Farkas, Z., Stern, T., Aszódi, A., and Zelzer, E., Muscle contraction controls skeletal morphogenesis through regulation of chondrocyte convergent extension, 154-163, Copyright (2012) with permission from Elsevier. Full text @ Dev. Biol.