
|
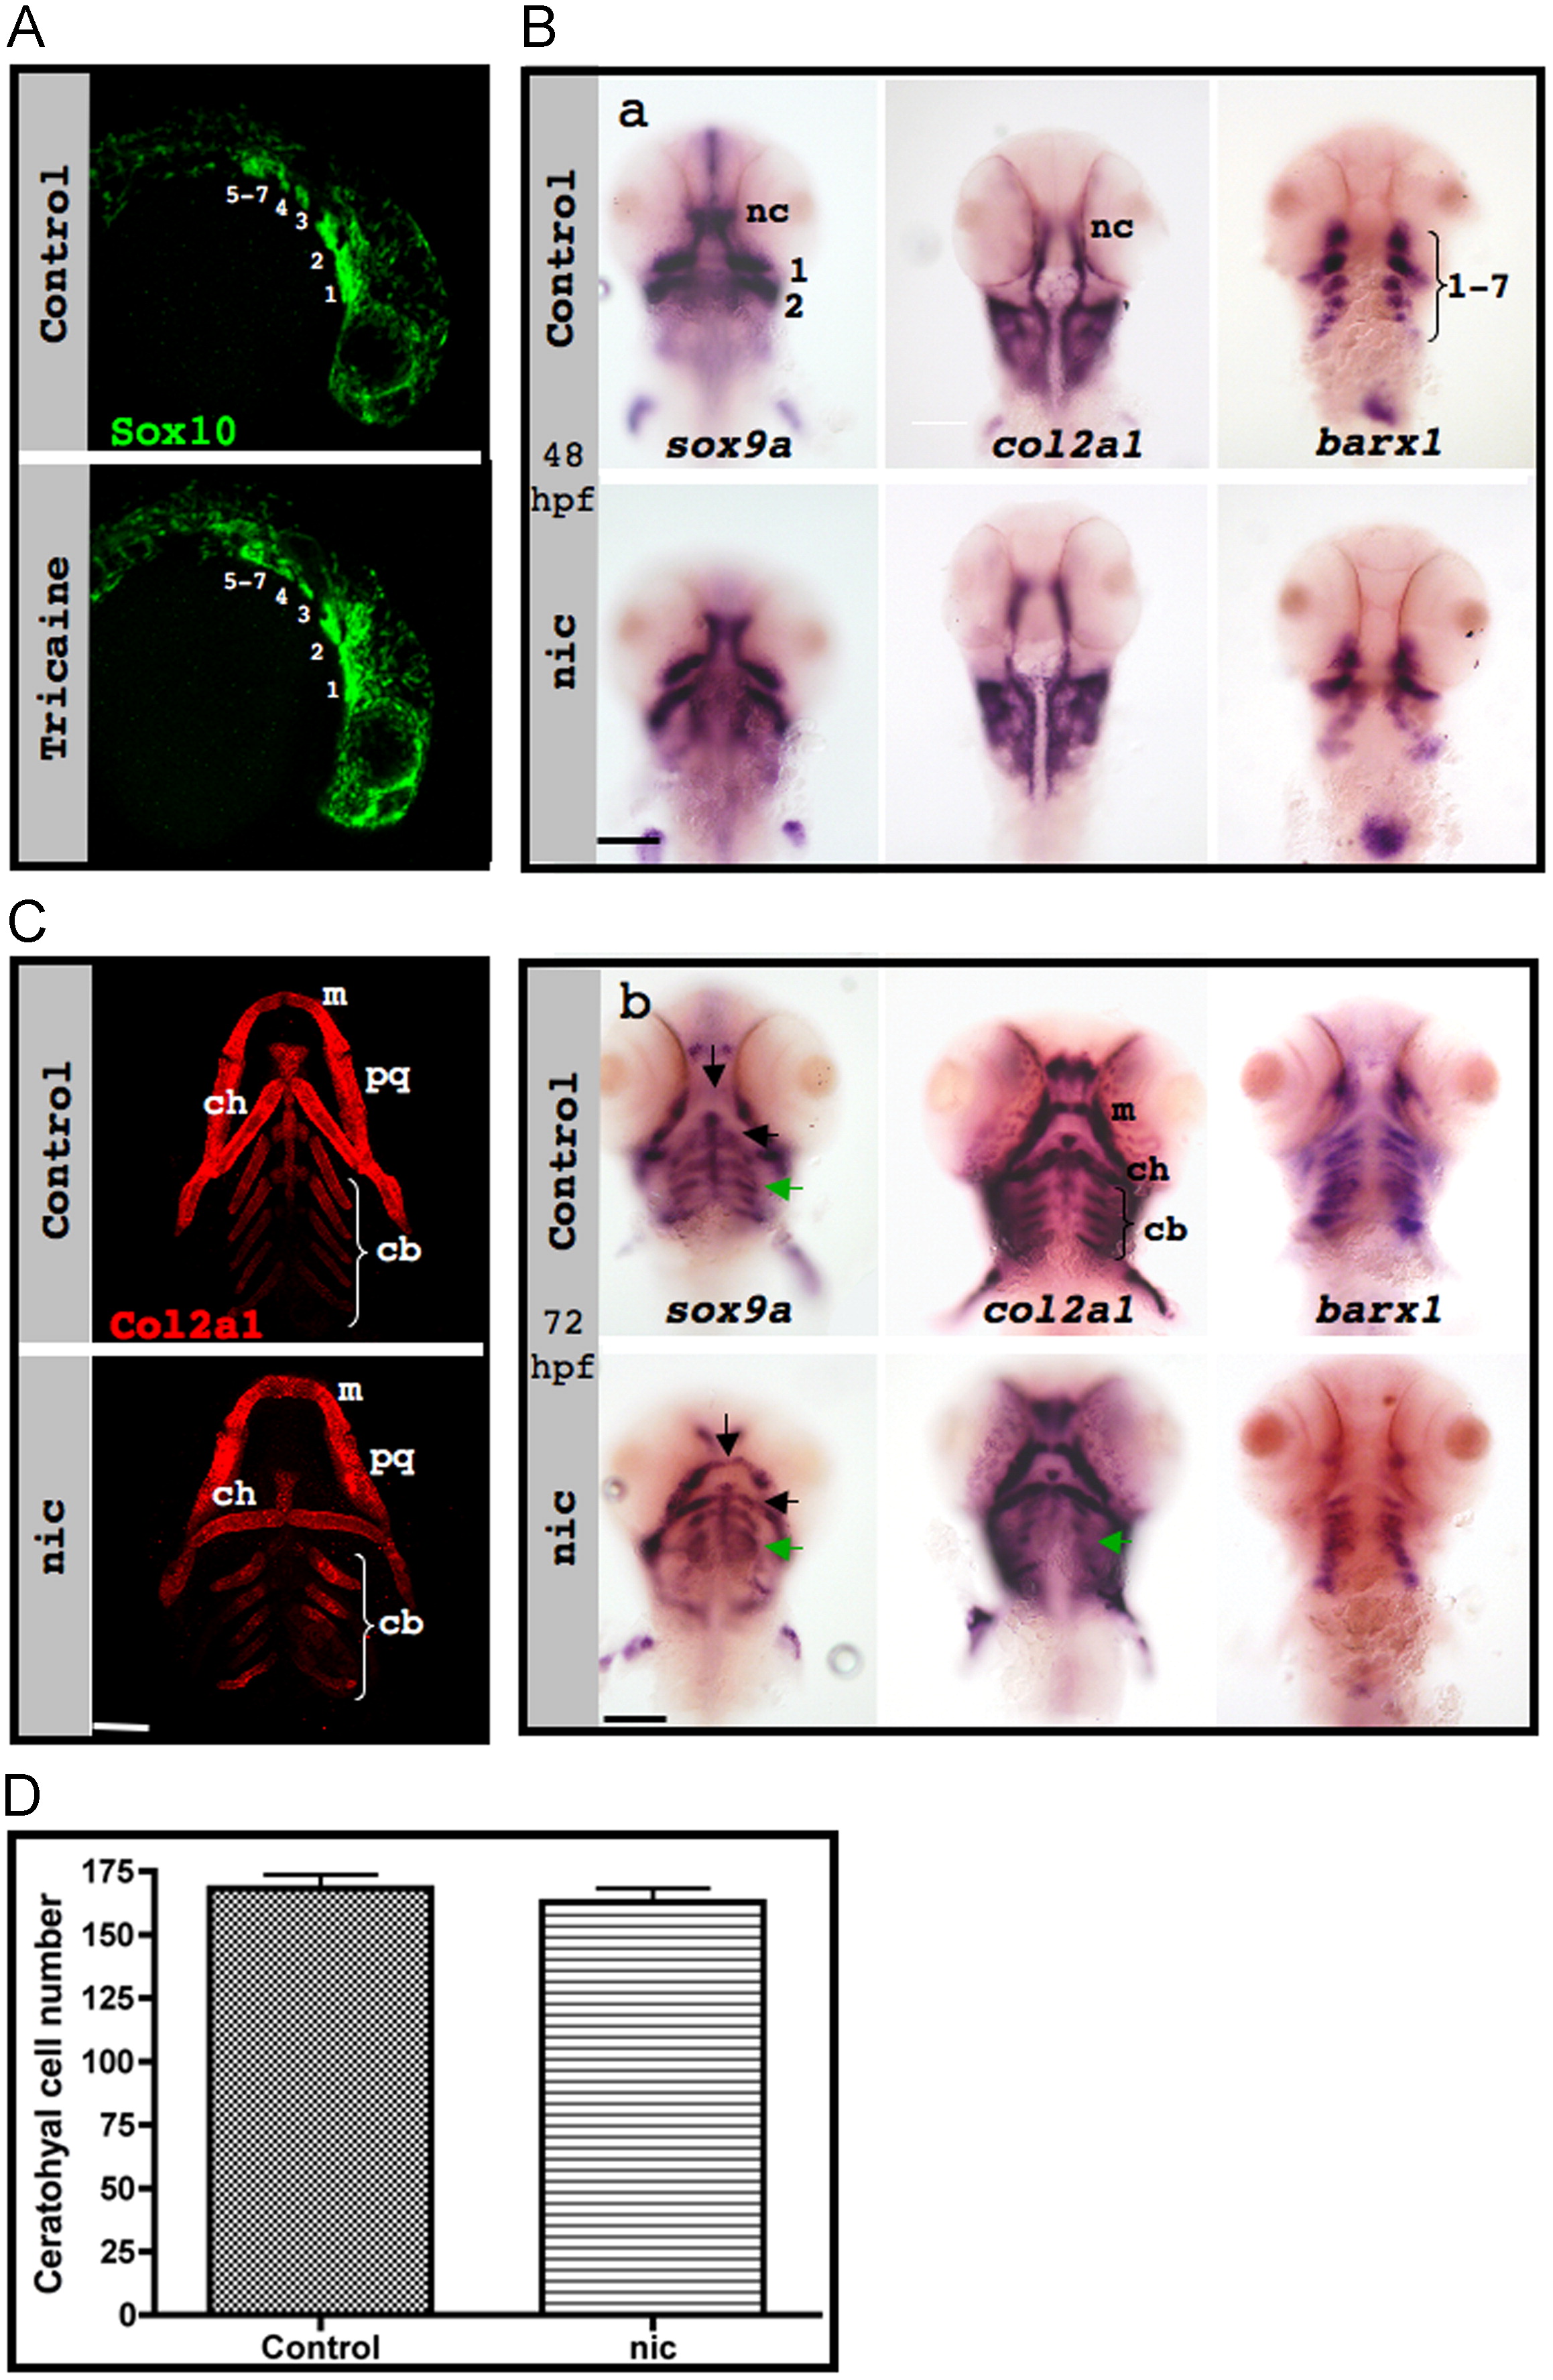
Fig. 2 Neural crest specification, migration and differentiation in the absence of muscle contraction. (A) sox10 expression (green) in confocal images of control (upper panel) and paralyzed (lower panel) 25 hpf zebrafish embryos; numbers indicate pharyngeal arches. (B) In situ hybridization of control (upper panels) and nic mutant (lower panels) embryos demonstrates the expression patterns of sox9a (left), col2a1 (middle) and barx1 (right) at 48 hpf (a) and at 72 hpf (b). Green arrows indicate ceratobranchial cartilage, and black arrows indicate Meckel′s cartilage and ceratohyal cartilage. (C) Immunostaining for col2a1 (red) of control (upper panel) and nic mutant 120 hpf zebrafish (lower panel). (D) Counting of cells that compose both ceratohyal cartilages of five controls and six 120 hpf nic mutants (p=0.4909). Scale bars are 100 μm.
Reprinted from Developmental Biology, 370(1), Shwartz, Y., Farkas, Z., Stern, T., Aszódi, A., and Zelzer, E., Muscle contraction controls skeletal morphogenesis through regulation of chondrocyte convergent extension, 154-163, Copyright (2012) with permission from Elsevier. Full text @ Dev. Biol.