
|
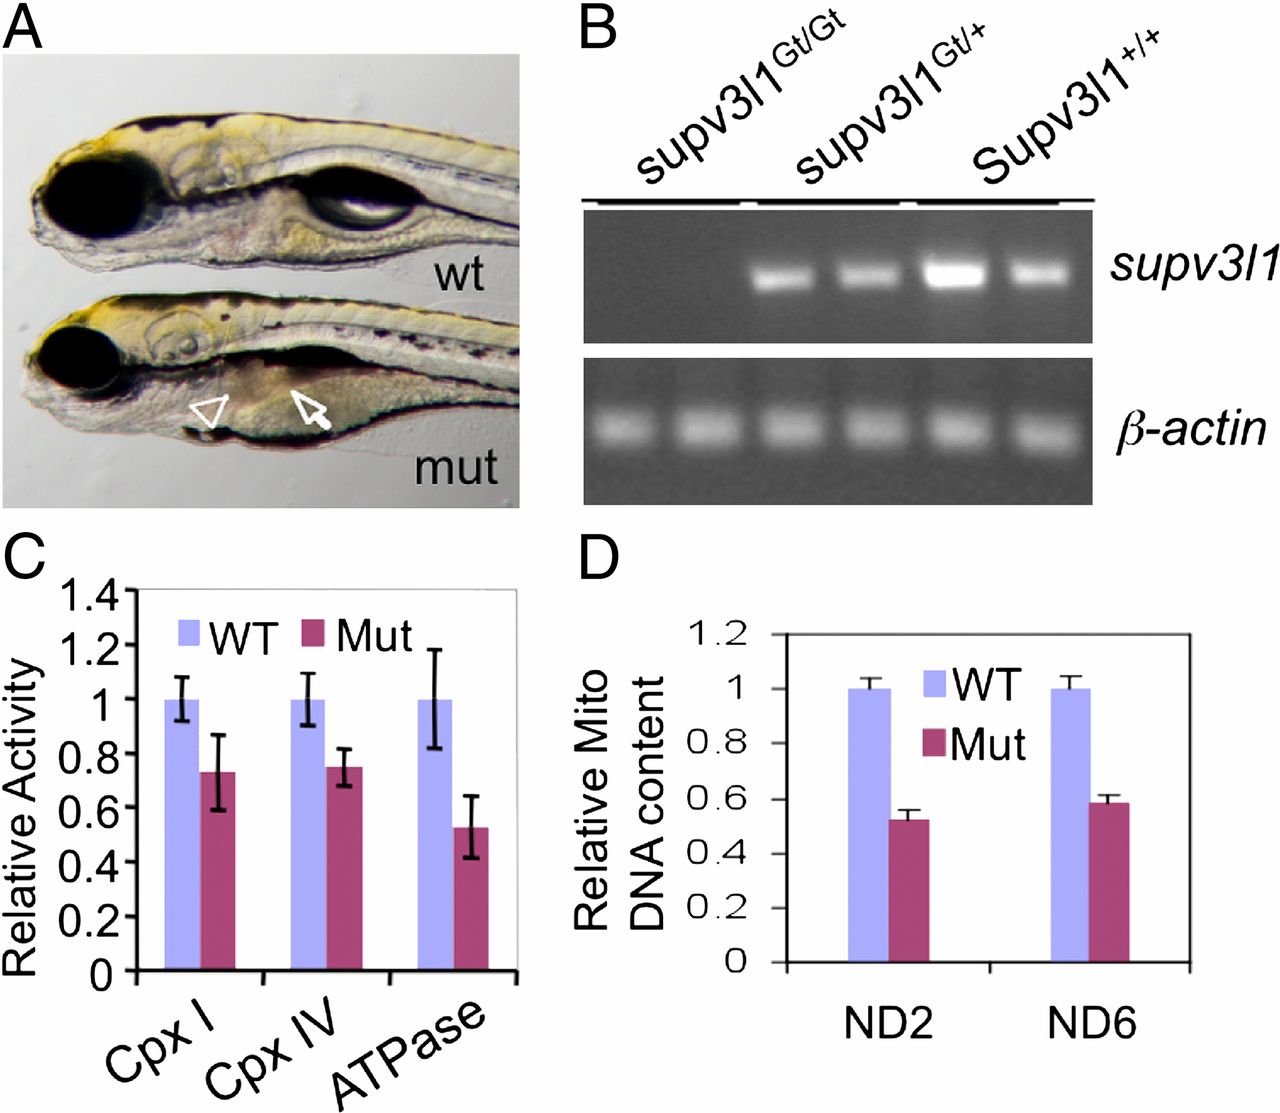
Fig. 3 Phenotypes of supv3l1GtT/GtT mutants. (A) Gross morphological defects at 5 dpf in supv3l1Gt/Gt showing smaller eyes, lack of an inflated swim bladder, small and dark liver (arrowhead), and underdeveloped and dark intestine (arrow). (B) RT-PCR analysis showing undetectable supv3l1 mRNA in the mutant (Upper ) with normal β-actin mRNA levels (Lower). (C) Bar graph (mean ± SE) of whole-animal Western blot analysis of the levels of components of mitochondrial complexes showing a decrease in the levels of NDUFB6 (complex I), CoxVa (complex IV), and F-ATPase (complex V) in the mutants (n = 4). P < 0.05 for complex IV and ATPase. The difference for complex I did not reach statistical significance (P = 0.12). (D) Bar graph (mean ± SEM) showing a decrease in mitochondrial DNA relative to nuclear DNA (β-actin 2) (n = 4). P < 0.05 for both ND2 and ND6. n = 4.