
|
Fig. 5
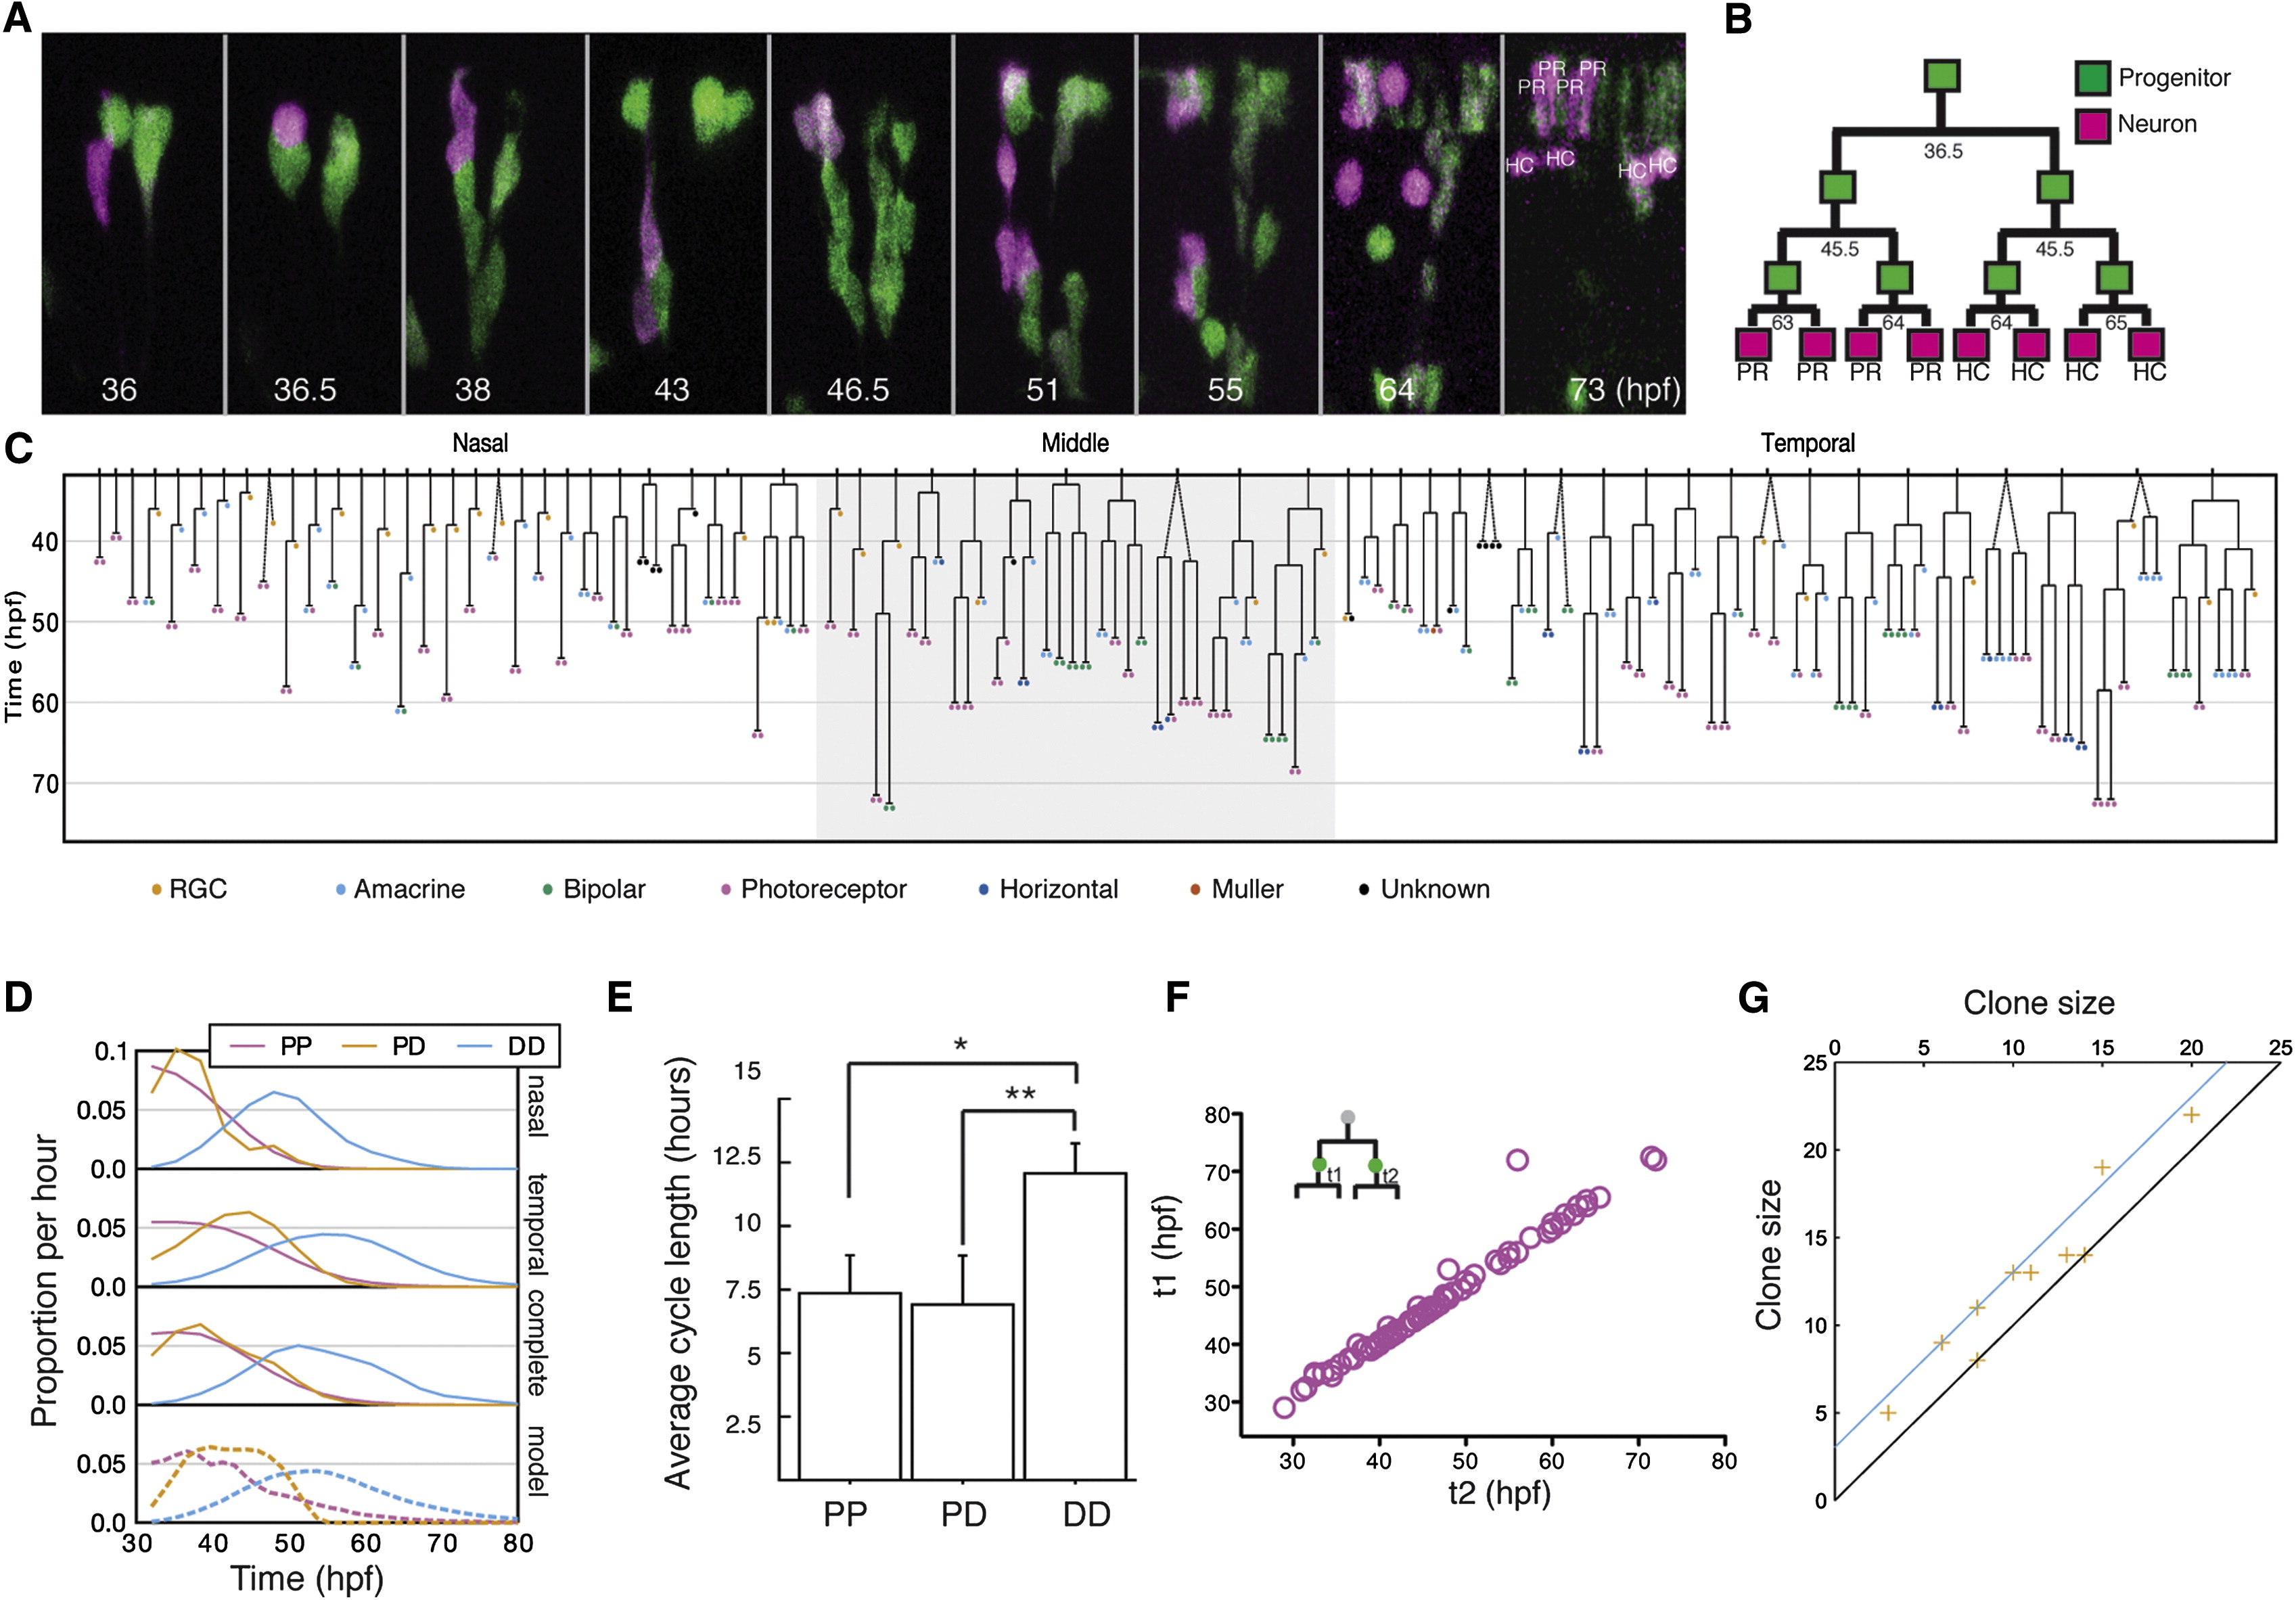
In Vivo Time Lapse of Retinal Clone Development (A) An image series of the generation of an eight-cell clone from a single RPC photoconverted at 32 hpf (magenta). (B) The schematically reconstructed lineage tree for the clone in (A). (C) Summary of 60 complete retina lineages induced at 32 hpf reconstructed from in vivo live imaging. Dashed lines indicate clones in which the first division happened between photoconversion and start of time lapse. (D) The normalized rates of different division modes evolve over time, derived from the lineages recorded in (C), compared to model prediction (dashed lines in bottom panel). (E) The bar graph shows the length of cell cycle that leads to the three division modes. PP, symmetric proliferation; PD, asymmetric differentiation; DD, symmetric differentiation. Values are represented as mean ± SEM (n = 28, 16, and 118 for PP, PD, and DD, respectively; *p < 0.05, **p < 0.05; Student’s t test). (F) The division time of sister RPCs (t1 and t2) within the time window of 24 and 72 hpf, indicating the synchrony of sister divisions. (G) The correlation between sizes of sister lineages (orange crosses) compares well with the expected correlation due to synchronization of second mitosis induced by proximity in space and time of sister RPCs (cyan).