
|
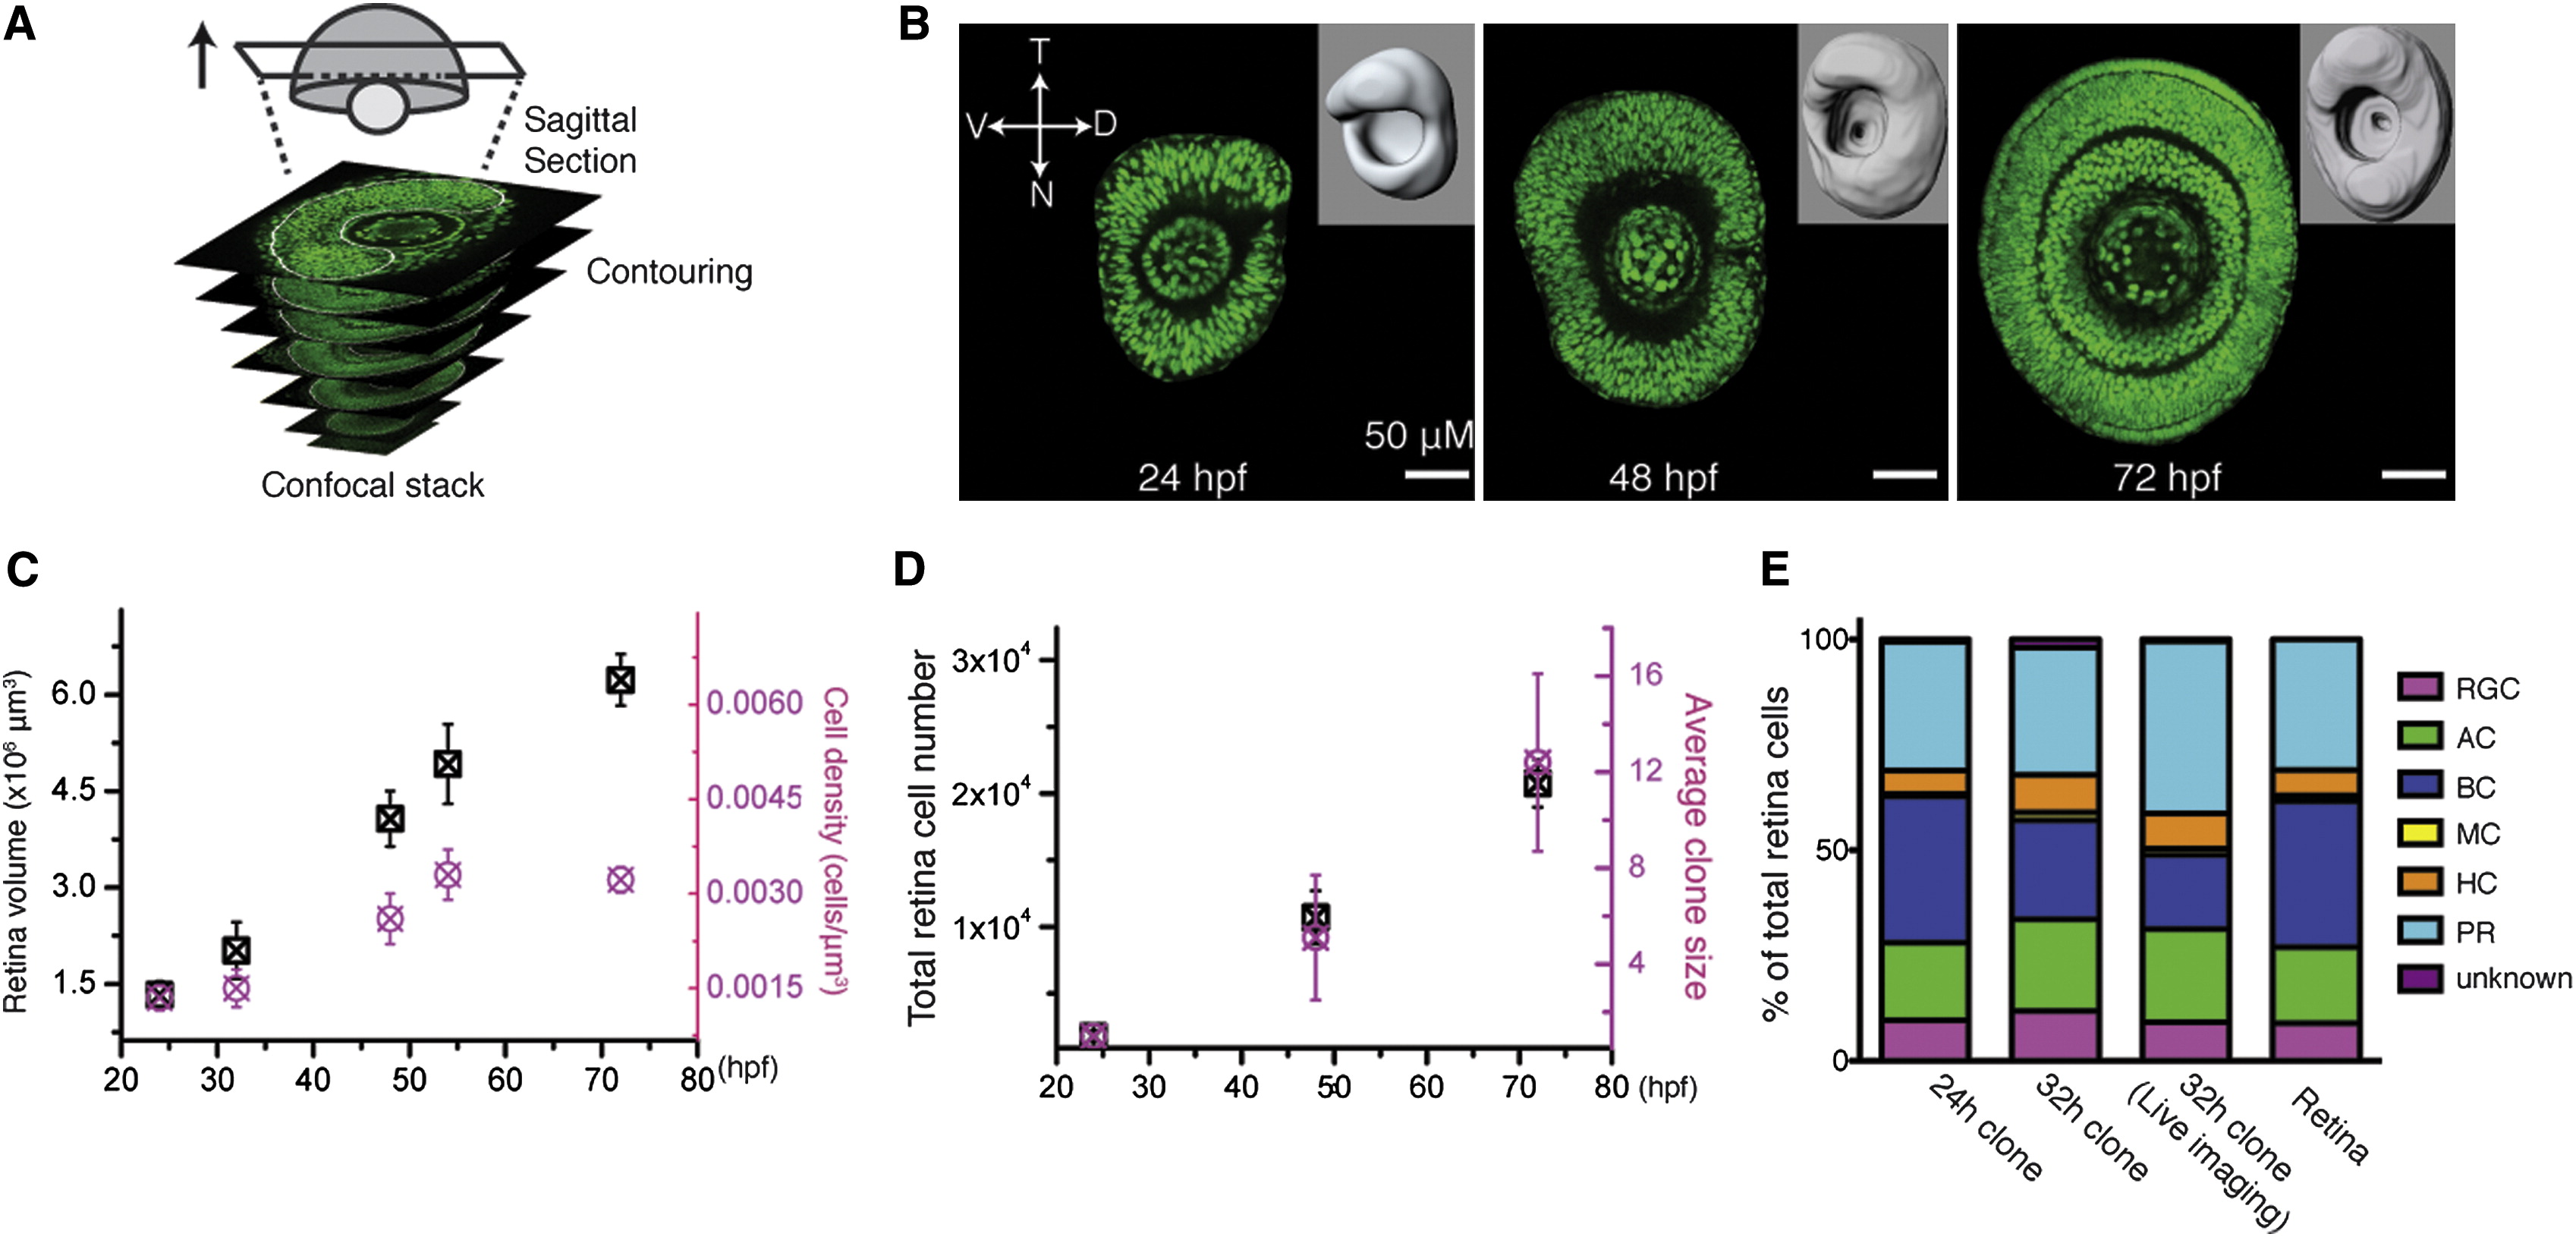
Fig. 2
Retinal Clones Represent Retinal Growth (A) A schematic diagram of the retinal surface creation by contouring in sagittal sections (white dashed lines) of a confocal stack. (B) Representative images of the sagittal sections and the created retina surfaces (inserts) at distinct developmental stages. (C) Retinal volume (black) and average cell density (magenta) increase over time. Values are represented as mean ± SD (n = 8, 7, and 5 for the retinas at 24, 48, and 72 hpf). (D) Clone growth (magenta, photoconverted at 24 hpf) matches retina total cell growth (black) over time. Values are represented as mean ± SD (n = 8, 7, and 5 for the retinas at 24, 48, and 72 hpf). (E) Seventy-two hour postfertilization cell compositions of the clones photoconverted at 24 (24 hr clones, n = 64) and 32 hpf (32 hr clones, n = 169; 32 hr clone in live imaging, n = 67) are comparable to that of the retina.