
|
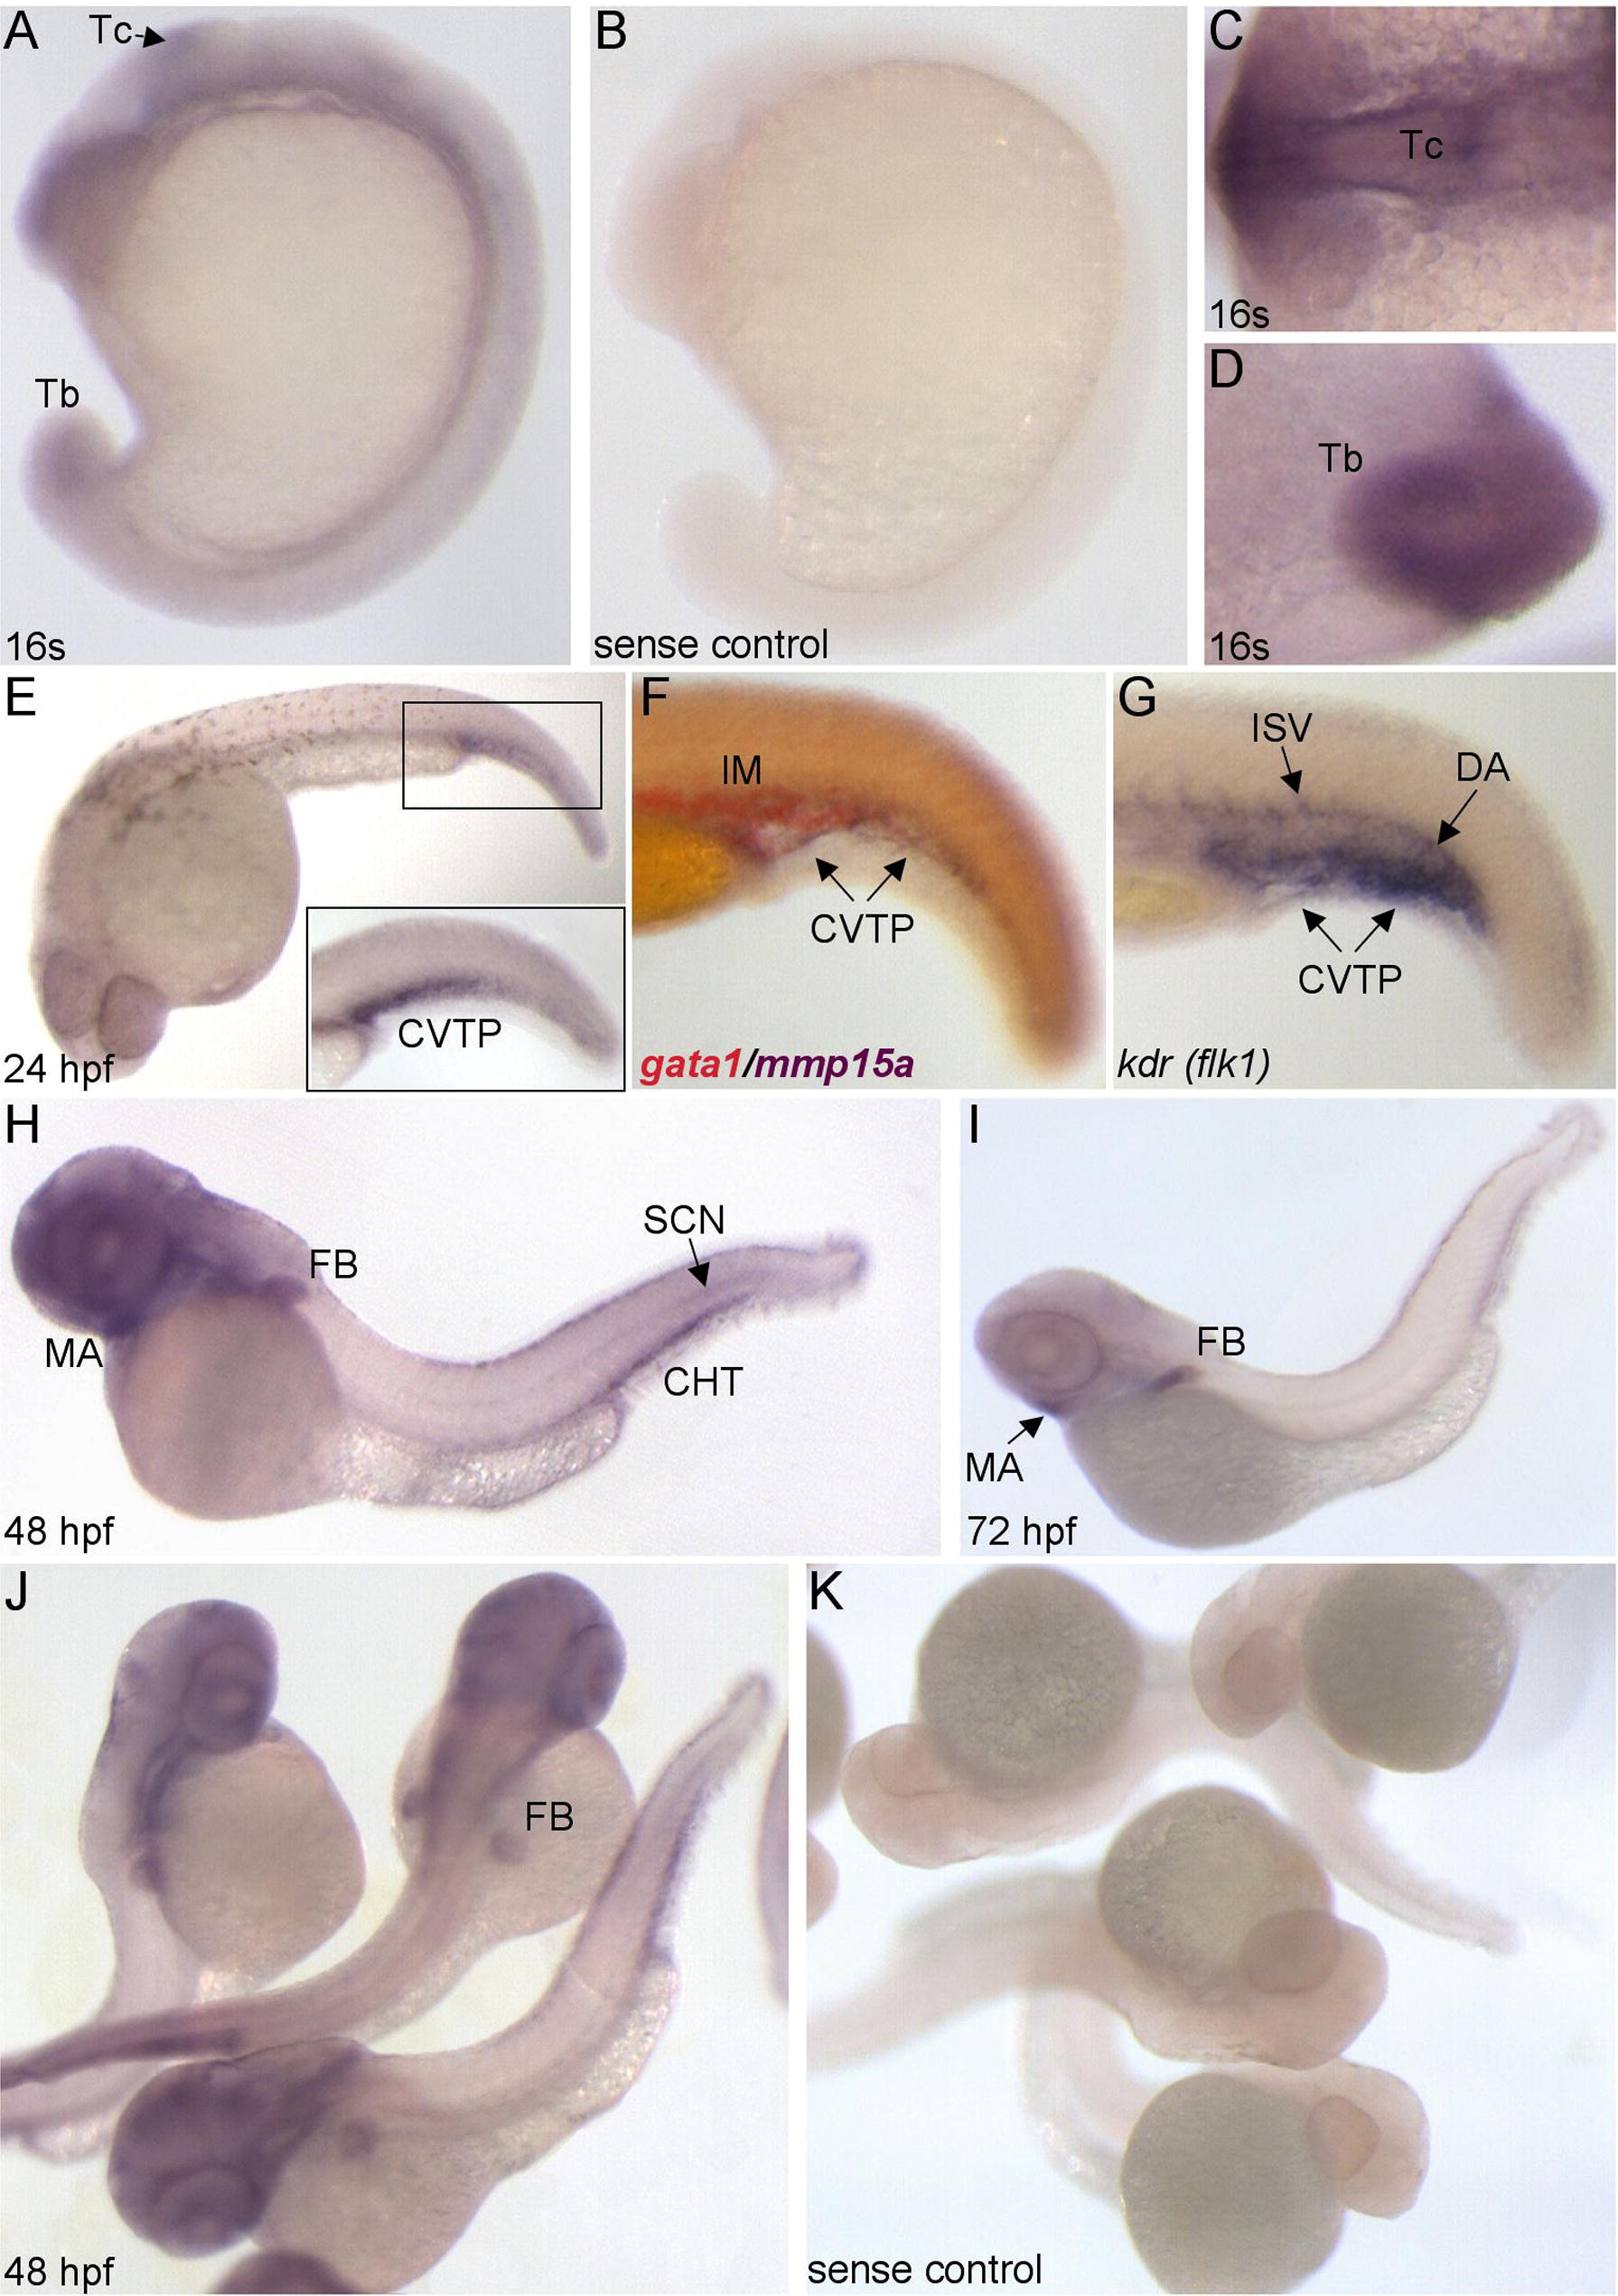
Fig. 3
Expression pattern of mmp15a examined using whole-mount RNA in situ hybridization. (A and B) Lateral views of 16-somite stage (16s) embryos with ventral to the left and anterior to the top. Close-up dorsal view of the tectum, Tc (C) and ventral view of the tailbud, Tb (D). (E–G) Lateral views of 24 hpf embryos labeled for mmp15a, gata1/mmp15a, and kdrl (flk1). Inset in panel (E) shows close-up of the cardinal vein tail plexus, CVTP. (H, J, and K) Lateral/dorsal views of 48 hpf embryos with anterior to the left (H). (I) Lateral view of 72 hpf embryo with anterior to the left. CHT, caudal hematopoietic tissue; DA, dorsal aorta; FB, fin bud; IM, intermediate cell mass; ISV, intersegmental vessels; MA, mandibular arch; SCN, spinal cord neurons.
Reprinted from Gene expression patterns : GEP, 12(7-8), Quick, R.E., Dunlap, J.A., and Jessen, J.R., Expression analysis of zebrafish membrane type-2 matrix metalloproteinases during embryonic development, 254-260, Copyright (2012) with permission from Elsevier. Full text @ Gene Expr. Patterns