
Image
|
Figure Caption
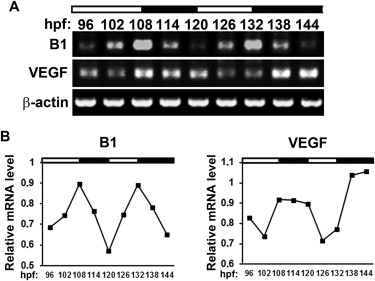
Fig. S4 RT-PCR Analysis of Circadian Rhythm of Zebrafish bmal1 and vegf Expression, Related to Figure 3(A) RT-PCR analysis of zebrafish bmal1 and vegf expression under LD conditions (a pooled sample of 25 zebrafish embryos/time point). Standard loading was indicated by β-actin expression.(B) Densitometric quantification of average ± SEM bmal1 and vegf expressions shown in (A).
Acknowledgments
This image is the copyrighted work of the attributed author or publisher, and
ZFIN has permission only to display this image to its users.
Additional permissions should be obtained from the applicable author or publisher of the image.
Full text @ Cell Rep.