
|
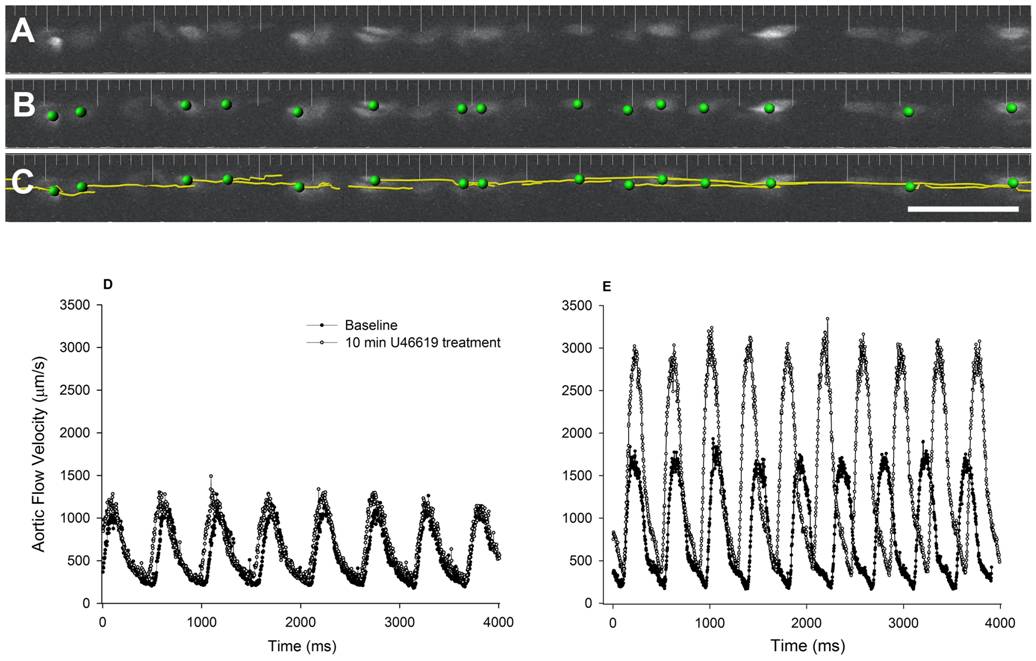
Fig. 3
Image processing was performed using Imaris software (Bitplane, Saint Paul, MN). Red blood cells shown in a representative single time point (A) were segmented by size, shape, and fluorescence intensity (B) and tracked using an auto-regressive tracking algorithm (C). The frequency of image collection was set such that erythrocyte displacement is less than one cell diameter/frame and therefore individual cells can be tracked with confidence. Only cells that could be tracked for >250 µm were included in the analysis. Quantitation revealed pulsatility of blood flow in both the 3 (D) and 5 (E) dpf embryos, and confirmed our ability to measure flow velocities greater than 2 mm/s in response to the thromboxane analogue U46619 (example shown in 5 dpf embryos, panel E, open circles).