
|
Fig. 2
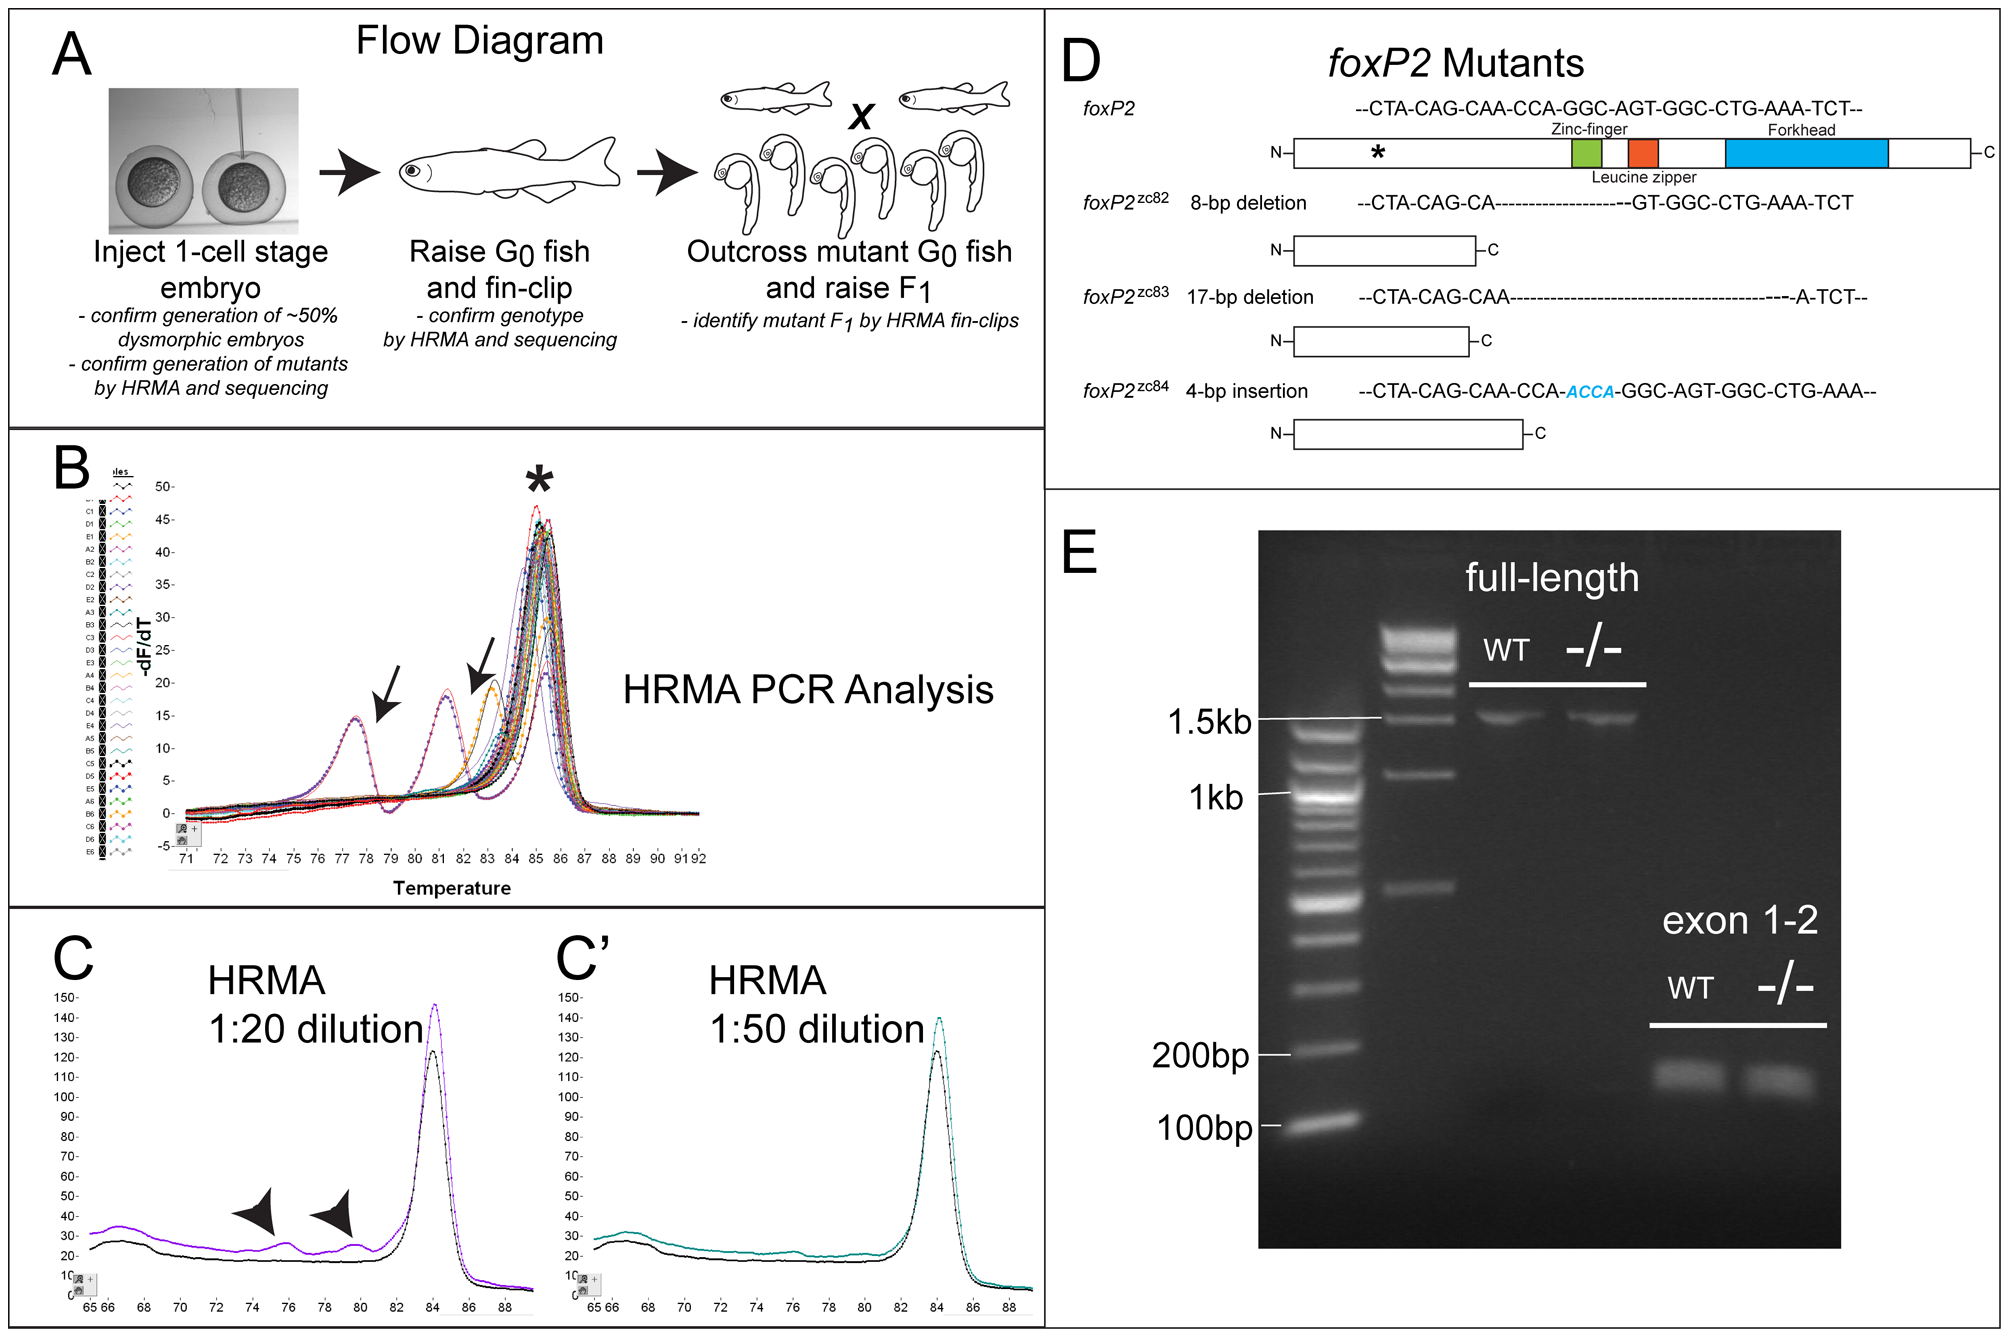
Flow diagram for generation of ZFN mutants, and HRMA analysis.
(A) Flow diagram illustrating steps in generation and identification of fish carrying ZFN-induced mutation. (B) Illustrative melt-curve (“HRMA” high-resolution melt analysis) of F1 generation foxP2 ZFN fish. Y-axis corresponds to the differential of the change (decrease) in fluorescence; X-axis is the temperature (°C). Each colored line is a different sample, arrows point to samples with mutations in the foxP2 amplicon; asterisk is the wild-type product. There is some variability in the melt temperature of the wild-type amplicon because of minor variations in starting template amount and salt concentrations. (C-C2) Melt-curves of dilutions of mutant foxP2 DNA. Abnormal melt curves (arrowheads) are detected at dilutions of 1:20 mutant:wild-type DNA, but not (or very minimally) at a dilution of 1:50. (D) Schematic diagram of foxP2 protein domains; asterisk shows the targeted region for ZFN mutagenesis; sequence above the picture is the nucleotide sequence targeted. Below are shown the three alleles, with the sequence of the mutation, and a picture of the predicted protein. (E) RT-PCR from wt or foxP2 homozygous mutant embryos at 72hpf, with primers for the full-length transcript, or encompassing exons 1–2. No alternative splice variants were noted, and sequencing of the foxP2 mutant PCR product showed that the mutations led to the predicted out-of-frame sequence.