
|
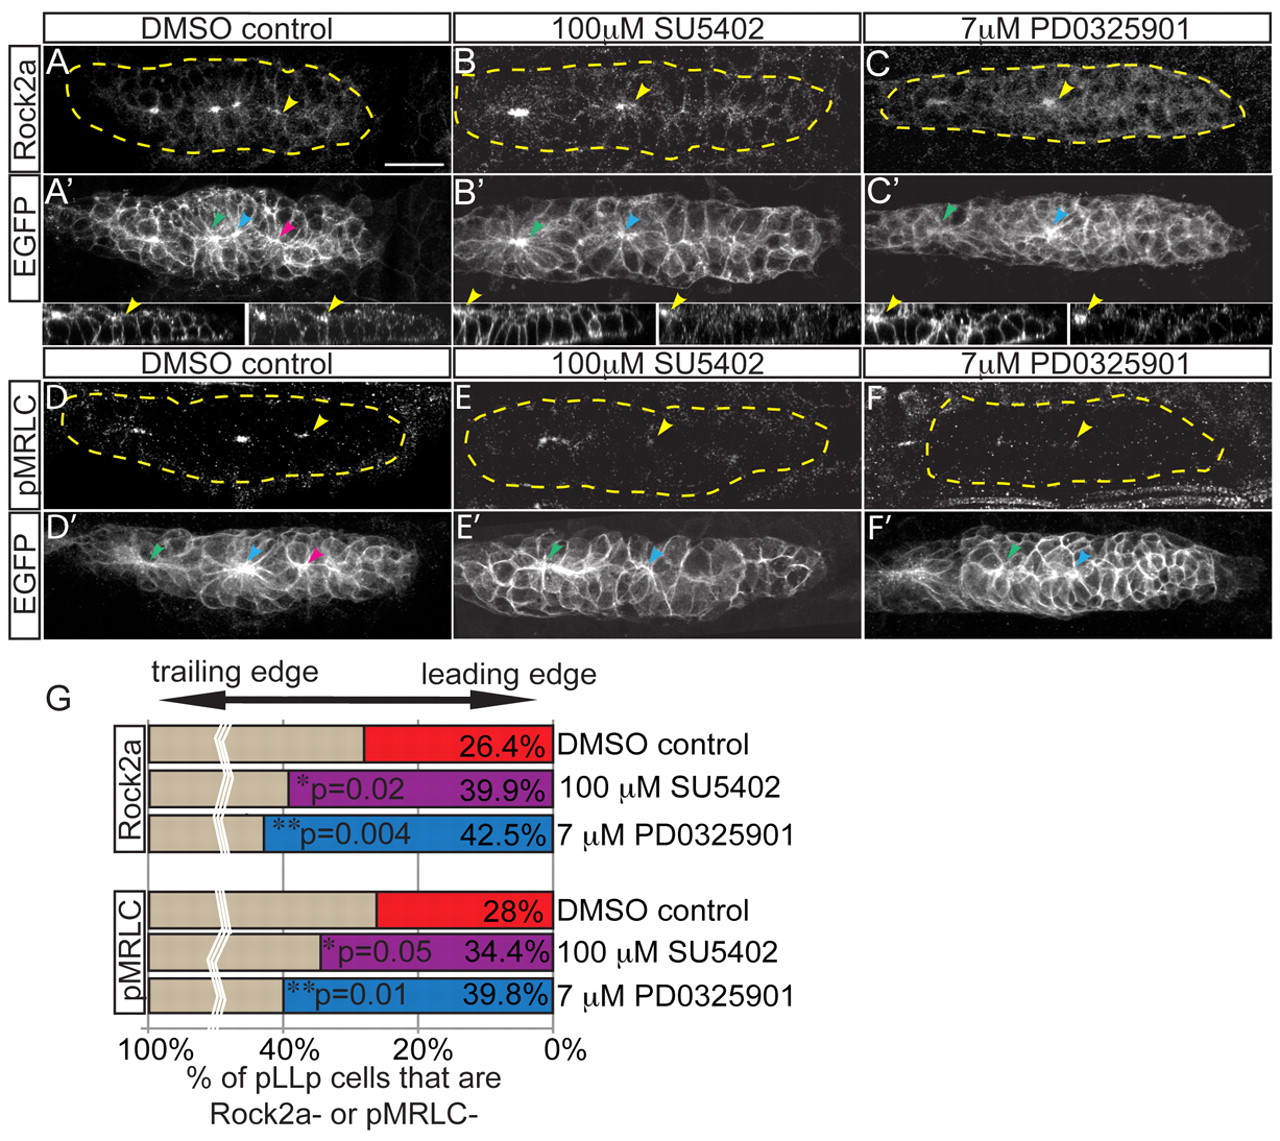
Fig. 3
Fgf and MAPK signaling are required for localization of Rock2a and MRLC activation. (A-F2) Fgfr or MAPKK inhibition with SU5402 or PD0325901, respectively, from 28-30 hpf in claudinB:EGFP zebrafish embryos. Lower panels show sagittal view of leading pLLp region (left, EGFP; right, Rock2a). Post-treatment, Rock2a (A-C) and pMRLC (D-F) were assayed by immunolabeling. Yellow arrowheads indicate the caudal-most apical accumulation of Rock2a. Note that Rock2a is not localized to apical ends of cells in the leading region following treatments. pMRLC staining shows failure of leading-region MRLC activation following treatments. (G) Quantification of the leading region (performed as in Fig. 2H). Rock2a (n=6 embryos; P<0.03, ANOVA) and pMRLC (n=6 embryos; P<0.003, ANOVA) are not apically localized. Note there are fewer leading cells with apically localized Rock2a in Fgf-inhibited (39.9±1.1%) and MAPKK-inhibited (42.5±1.4%) embryos compared with the control (26.4±1.5%). For pMRLC staining: DMSO, 28.0±0.7%; SU5402, 34.4±0.6%; and PD0325901, 39.8±1.0%. Scale bar: 20 μm.