
|
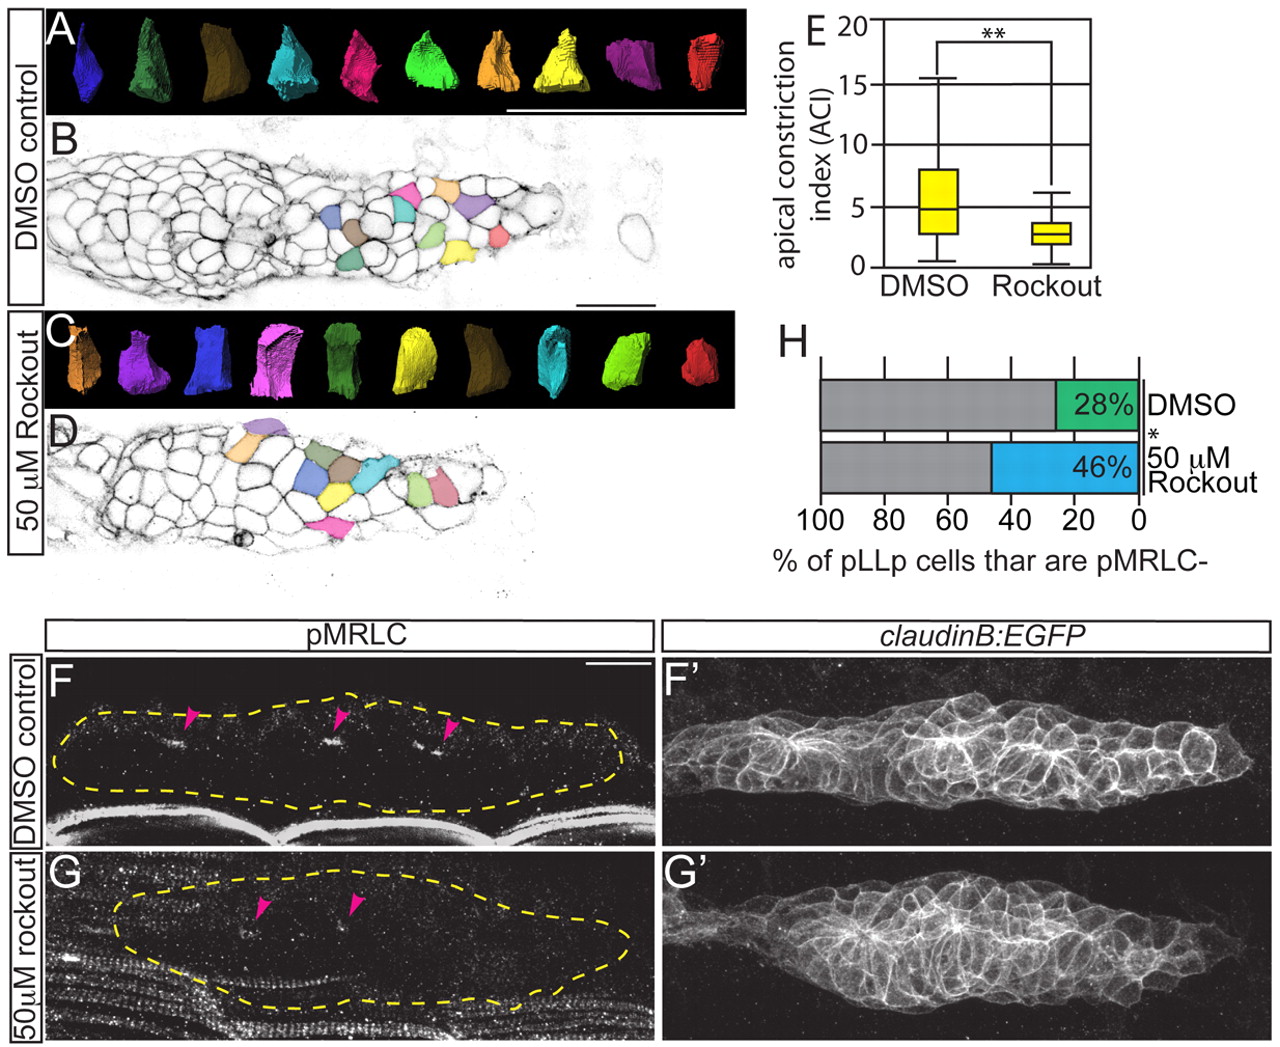
Fig. 2
Rho kinase activity is required for rosette formation, apical constriction and MRLC activation. claudinB:EGFP zebrafish embryos were treated from 28 to 30 hpf with the Rho kinase inhibitor Rockout. (A-D) ACIs were then measured for the leading-most 30 cells (C,D) and compared with DMSO-treated controls (A,B). Colors of surfaces in A,C correspond to cell positions in B,D. (E) ACI measurements from embryos treated with Rockout or DMSO. n=180 cells from six embryos per condition. **P<0.0001, Wilcoxon test. Error bars indicate s.e.m. (F-G2) Immunolabeling showing loss of pMRLC from the leading region following Rockout treatment as compared with control. (H) Quantification of the leading region, where pMRLC is not detected. *P<0.0001, Student’s t-test. Percentages were derived by counting the number of cells caudal to the distalmost pMRLC signal (i.e. the number of leading cells that lacked the signal) and normalizing to the total number of cells in the pLLp. Scale bars: 20 μm.