
|
Fig. S4
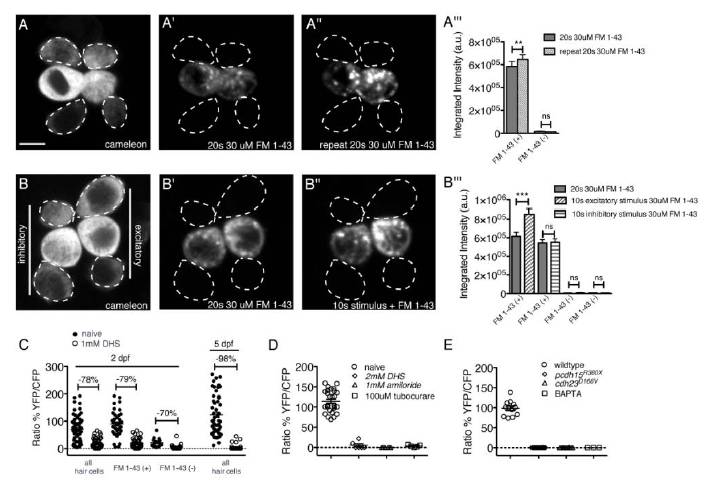
Related to Figure 6. FM 1-43 does not label all mechanosensitive hair cells at 2 dpf.
(A, A′, A′′ and A′′′) Fluorescent image of a neuromast expressing cameleon (A), after a 20 s incubation with 30 μM FM 1-43 (A′), and after an additional 20 s incubation with 30 μM FM1-43 (A′′). While this additional FM 1-43 application labeled FM 1-43 (+) hair cells more intensely, more hair cells were not labeled. This data is quantified in (A′′′) (n = 48 FM 1-43 (+), and 30 FM 1-43 (-) hair cells). (B, B′, B′′ and B′′′) A fluorescent image of a neuromast expressing cameleon (B), after 20 s with 30 μM FM 1-43 (B′), and after anterior (right side of neuromast) hair bundles were deflected in the excitatory direction in the presence of 30 μM FM 1-43 for 10 s (B′′). (B′′′) No additional hair cells were labeled (n = 15 FM 1-43 (-) hair cells). FM 1-43 (+) hair cells excited by the stimulus (n = 28) were labeled more intensely, whereas hair cells receiving an inhibitory stimulus were not (n = 28). (C) The response of hair cells at 2 dpf or 5 dpf to a 2 s stimulus (solid circles) and after bath application of 1 mM DHS (open circles; 2 dpf: n = 58 hair cells; 5 dpf: n = 50 hair cells). These data were split into FM 1-43 (+) and FM 1-43 (-) populations and replotted. The percentage reduction in the mean is shown for each group. (D) Mechanotransduction blockers DHS, amiloride and curare significantly (P > 0.001) blocked hair-cell calcium responses (n > 5 neuromasts per treatment). (E) Hair cells deficient in tip-link components Cdh23 or Pcdh15 did not respond to deflection. BAPTA treatment to remove tip links also abolished all responses (n > 12 neuromast per genotype or treatment). Dashed lines indicate hair cells that failed to label with FM 1-43. A paired Student’s t-test was used to compare changes in intensity in (A′′′ and B′′′) and calcium responses in (D and E). When normalized to naïve response, a Wilcoxon matched-pairs signed rank test found no significant difference in the reduction between dye labeled (solid circles), and or unlabeled (open circles) hair cell populations at 2 dpf in (C). Error bars in A′′′, B′′′, C and E represent s.e.m. ** P < 0.01, *** P < 0.001. The scale bar in (A) is 5 μm.
Reprinted from Developmental Cell, 23(2), Kindt, K.S., Finch, G., and Nicolson, T., Kinocilia mediate mechanosensitivity in developing zebrafish hair cells, 329-341, Copyright (2012) with permission from Elsevier. Full text @ Dev. Cell