
|
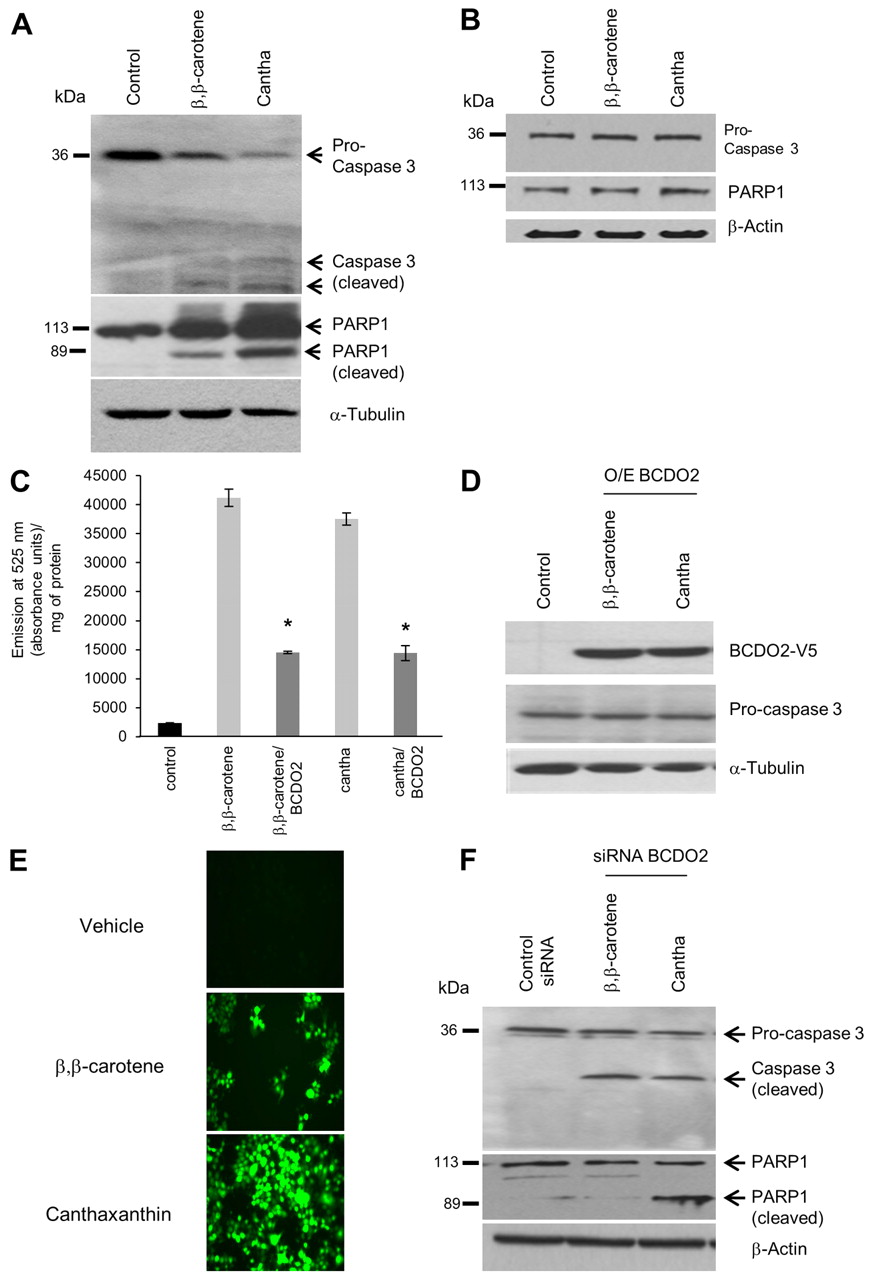
Fig. 8 BCDO2 determines susceptibility of cells to apoptosis induction by carotenoids. (A,B) HepG2 (A) and T47D (B) cells were incubated in the presence of vehicle, 1 μM BC and 1 μM canthaxanthin. After 2 hours, cells were harvested and protein extracts were subjected to immunoblot analysis using caspase 3 and PARP1 antiserum. (C,D) BCDO2 was expressed as a recombinant protein in HepG2 cells. At 40 hours post transfection, HepG2 cells were incubated in the presence of vehicle, 1 μM BC and 1 μM canthaxanthin, respectively. (C) After 2 hours, the non-fluorescent carboxy-H2DCFDA was added and fluorescence was quantified by emission of light at 525 nm and measured in absorbance units per milligram of protein. Assays were performed in duplicate and repeated three times. *P<0.05. Data are mean±s.e.m. (D) After 2 hours, cells were harvested and protein extracts were subjected to immunoblot analysis using caspase 3 and PARP1 antiserum. (E,F) T47D transfected with siRNA against bcdo2 were incubated in the presence of vehicle, 1 μM BC and 1 μM canthaxanthin. (E) After 2 hours, the H2DFCDA dye was added. Representative images were obtained with a Leica MM AF fluorescence microscope at 20× magnification. (F) After 2 hours, cells were harvested and protein extracts were subjected to immunoblot analysis using caspase 3 and PARP1 antiserum. β-Actin or α-tubulin were used as the protein loading control. Representative immunoblots are shown.