
|
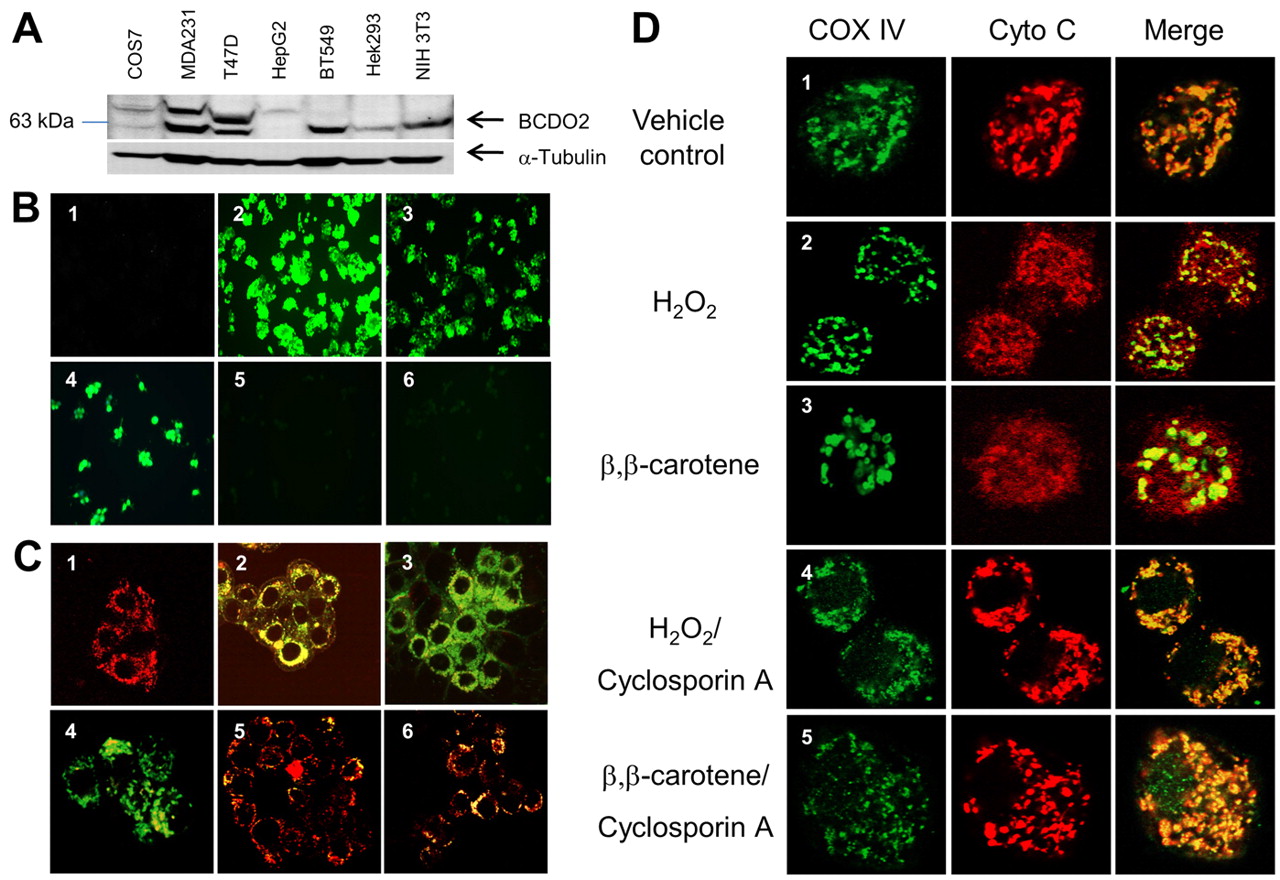
Fig. 7 Carotenoids induce mitochondrial oxidative stress and trigger cytochrome c release in a BCDO2-dependent manner. (A) Immunoblot analysis for BCDO2 protein expression in various human cell lines. Note that the BCDO2 antiserum detects an additional protein with higher molecular weight in some cell lines. (B) HepG2 cells (panels 1-3) were incubated in the presence of vehicle (panel 1), 1 μM BC (panel 2) and 1 μM canthaxanthin (panel 3). T47D cells (panels 4-6) were incubated in the presence of t-butyl hydroperoxide (panel 4), 1 μM BC (panel 5) and 1 μM canthaxanthin (panel 6). After a 2-hour incubation, the non-fluorescent carboxy-H2DCFDA dye was added, which (in the presence of reactive oxygen species) emits bright green fluorescence. Data were obtained from three independent experiments. Representative images were obtained with a fluorescence microscope at 20× magnification. (C) HepG2 cells (panels 1-3) were incubated in the presence of vehicle (panel 1), 1 μM BC (panel 2) and 1 μM canthaxanthin (panel 3). T47D cells (panels 4-6) were incubated in the presence of the membrane-depolarizing agent carbonylcyanide-m-chlorophenylhydrazone (panel 4), 1 μM BC (panel 5) and 1 μM canthaxanthin (panel 6). After a 2-hour incubation, the mitochondrial membrane potential was assessed by JC-1 staining. Red fluorescence of JC-1 aggregates is indicative of intact mitochondria (panel 1) and green fluorescence of JC-1 monomers dispersed in the cytoplasm indicates mitochondria with depolarized membrane potentials (panel 4). Data were obtained from three independent experiments. Representative images were taken under a confocal microscope at 20× magnification. (D) HepG2 cells (rows 1-5) were incubated in the presence of vehicle (row 1), 0.03% hydrogen peroxide (H2O2) (rows 2 and 4) and 1 μM BC (rows 3 and 5). Cells in panels 4 and 5 were pre-treated with cyclosporine A. Localization of cytochrome c and the mitochondrial marker protein COXIV was determined by confocal microscopy upon immunostaining at 63× magnification. Cytochrome c, red fluorescence; COXIV, green fluorescence; colocalization of cytochrome c and COXIV, yellow to orange fluorescence.