
Image
|
Figure Caption
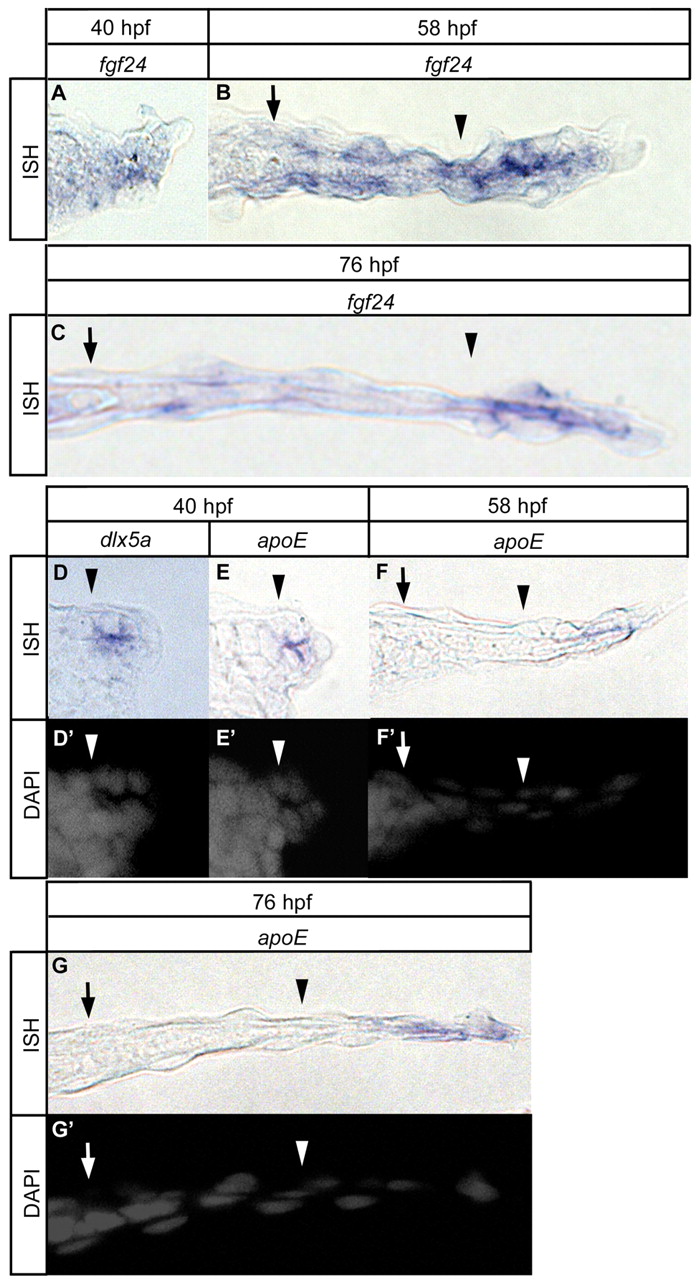
Fig. 4
Spatiotemporal expression pattern of AER/AF marker genes. (A-G) Spatial change of expression domain of fgf24 (A-C), dlx5a (D) and apoE (E-G) at the indicated stages. D2-G2 show cell organization (gray: DAPI). Distal is to the right; dorsal is to the top in transverse sections. Arrows indicate circumferential fin blood vessel. Arrowheads indicate the base of the AF notch.
Acknowledgments
This image is the copyrighted work of the attributed author or publisher, and
ZFIN has permission only to display this image to its users.
Additional permissions should be obtained from the applicable author or publisher of the image.
Full text @ Development