
|
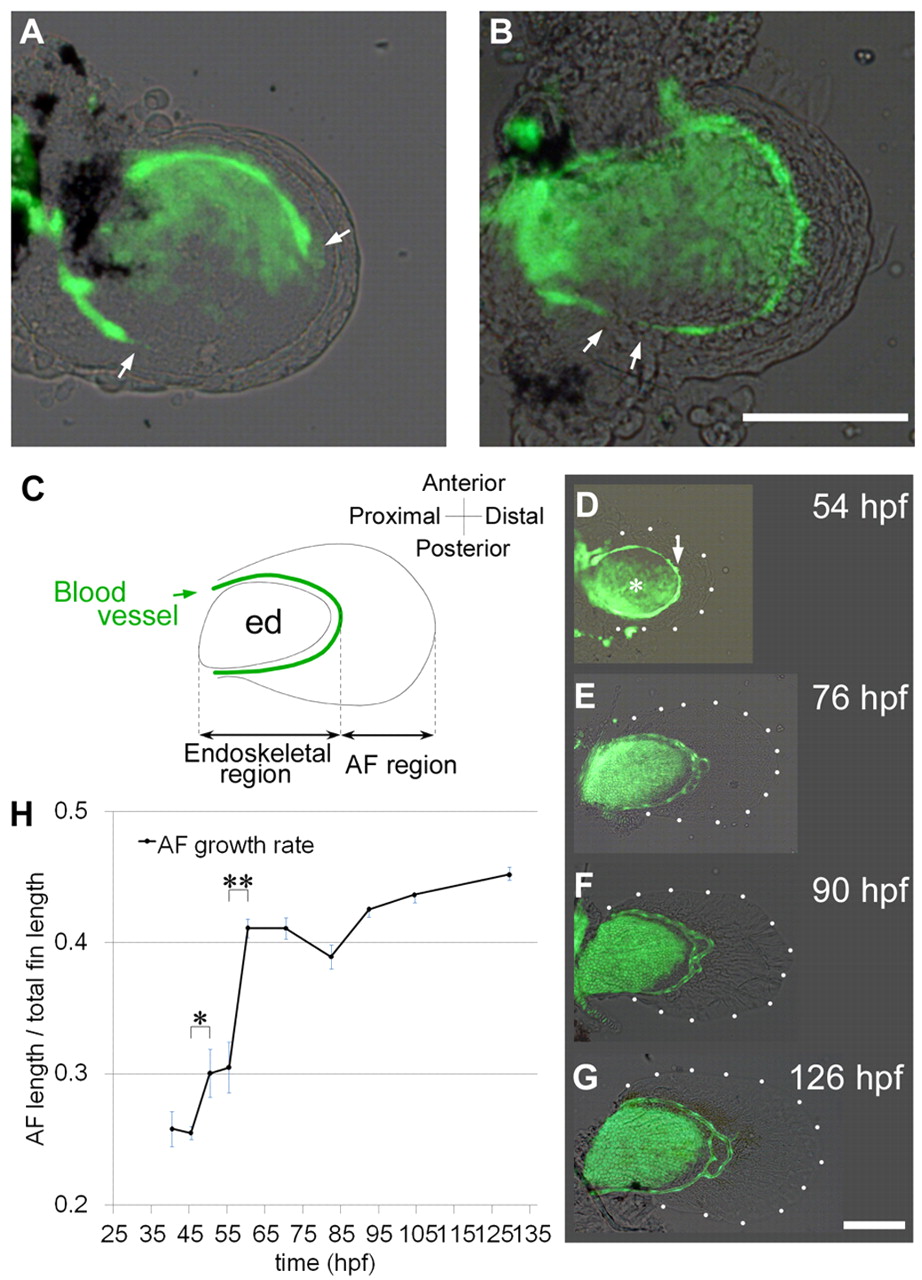
Fig. 2
Pectoral fin outgrowth after the AER-AF transition. (A,B) fli1:EGFP y1 fish fin at 43 (A) and 48 (B) hpf, showing developing circumferential fin blood vessel (white arrows). (C) Schematic of a pectoral fin bud. ed, endoskeletal disc. (D-G) Whole-mount observation of pectoral fin bud outgrowth at the indicated stages. GFP (green) was distributed in the circumferential blood vessel (white arrow) and the endoskeletal disc (asterisk). White dots indicate the fin margin. (H) Temporal changes in AF and endoskeletal region lengths (see also supplementary material Table S1). Error bars indicate s.e.m. AF growth rate (ratio of AF length to total length of the pectoral fin) increased most rapidly until <60 hpf (data were analyzed by Student’s t-test; *P<0.05; **P<0.001). Scale bars: 100 μm.