
|
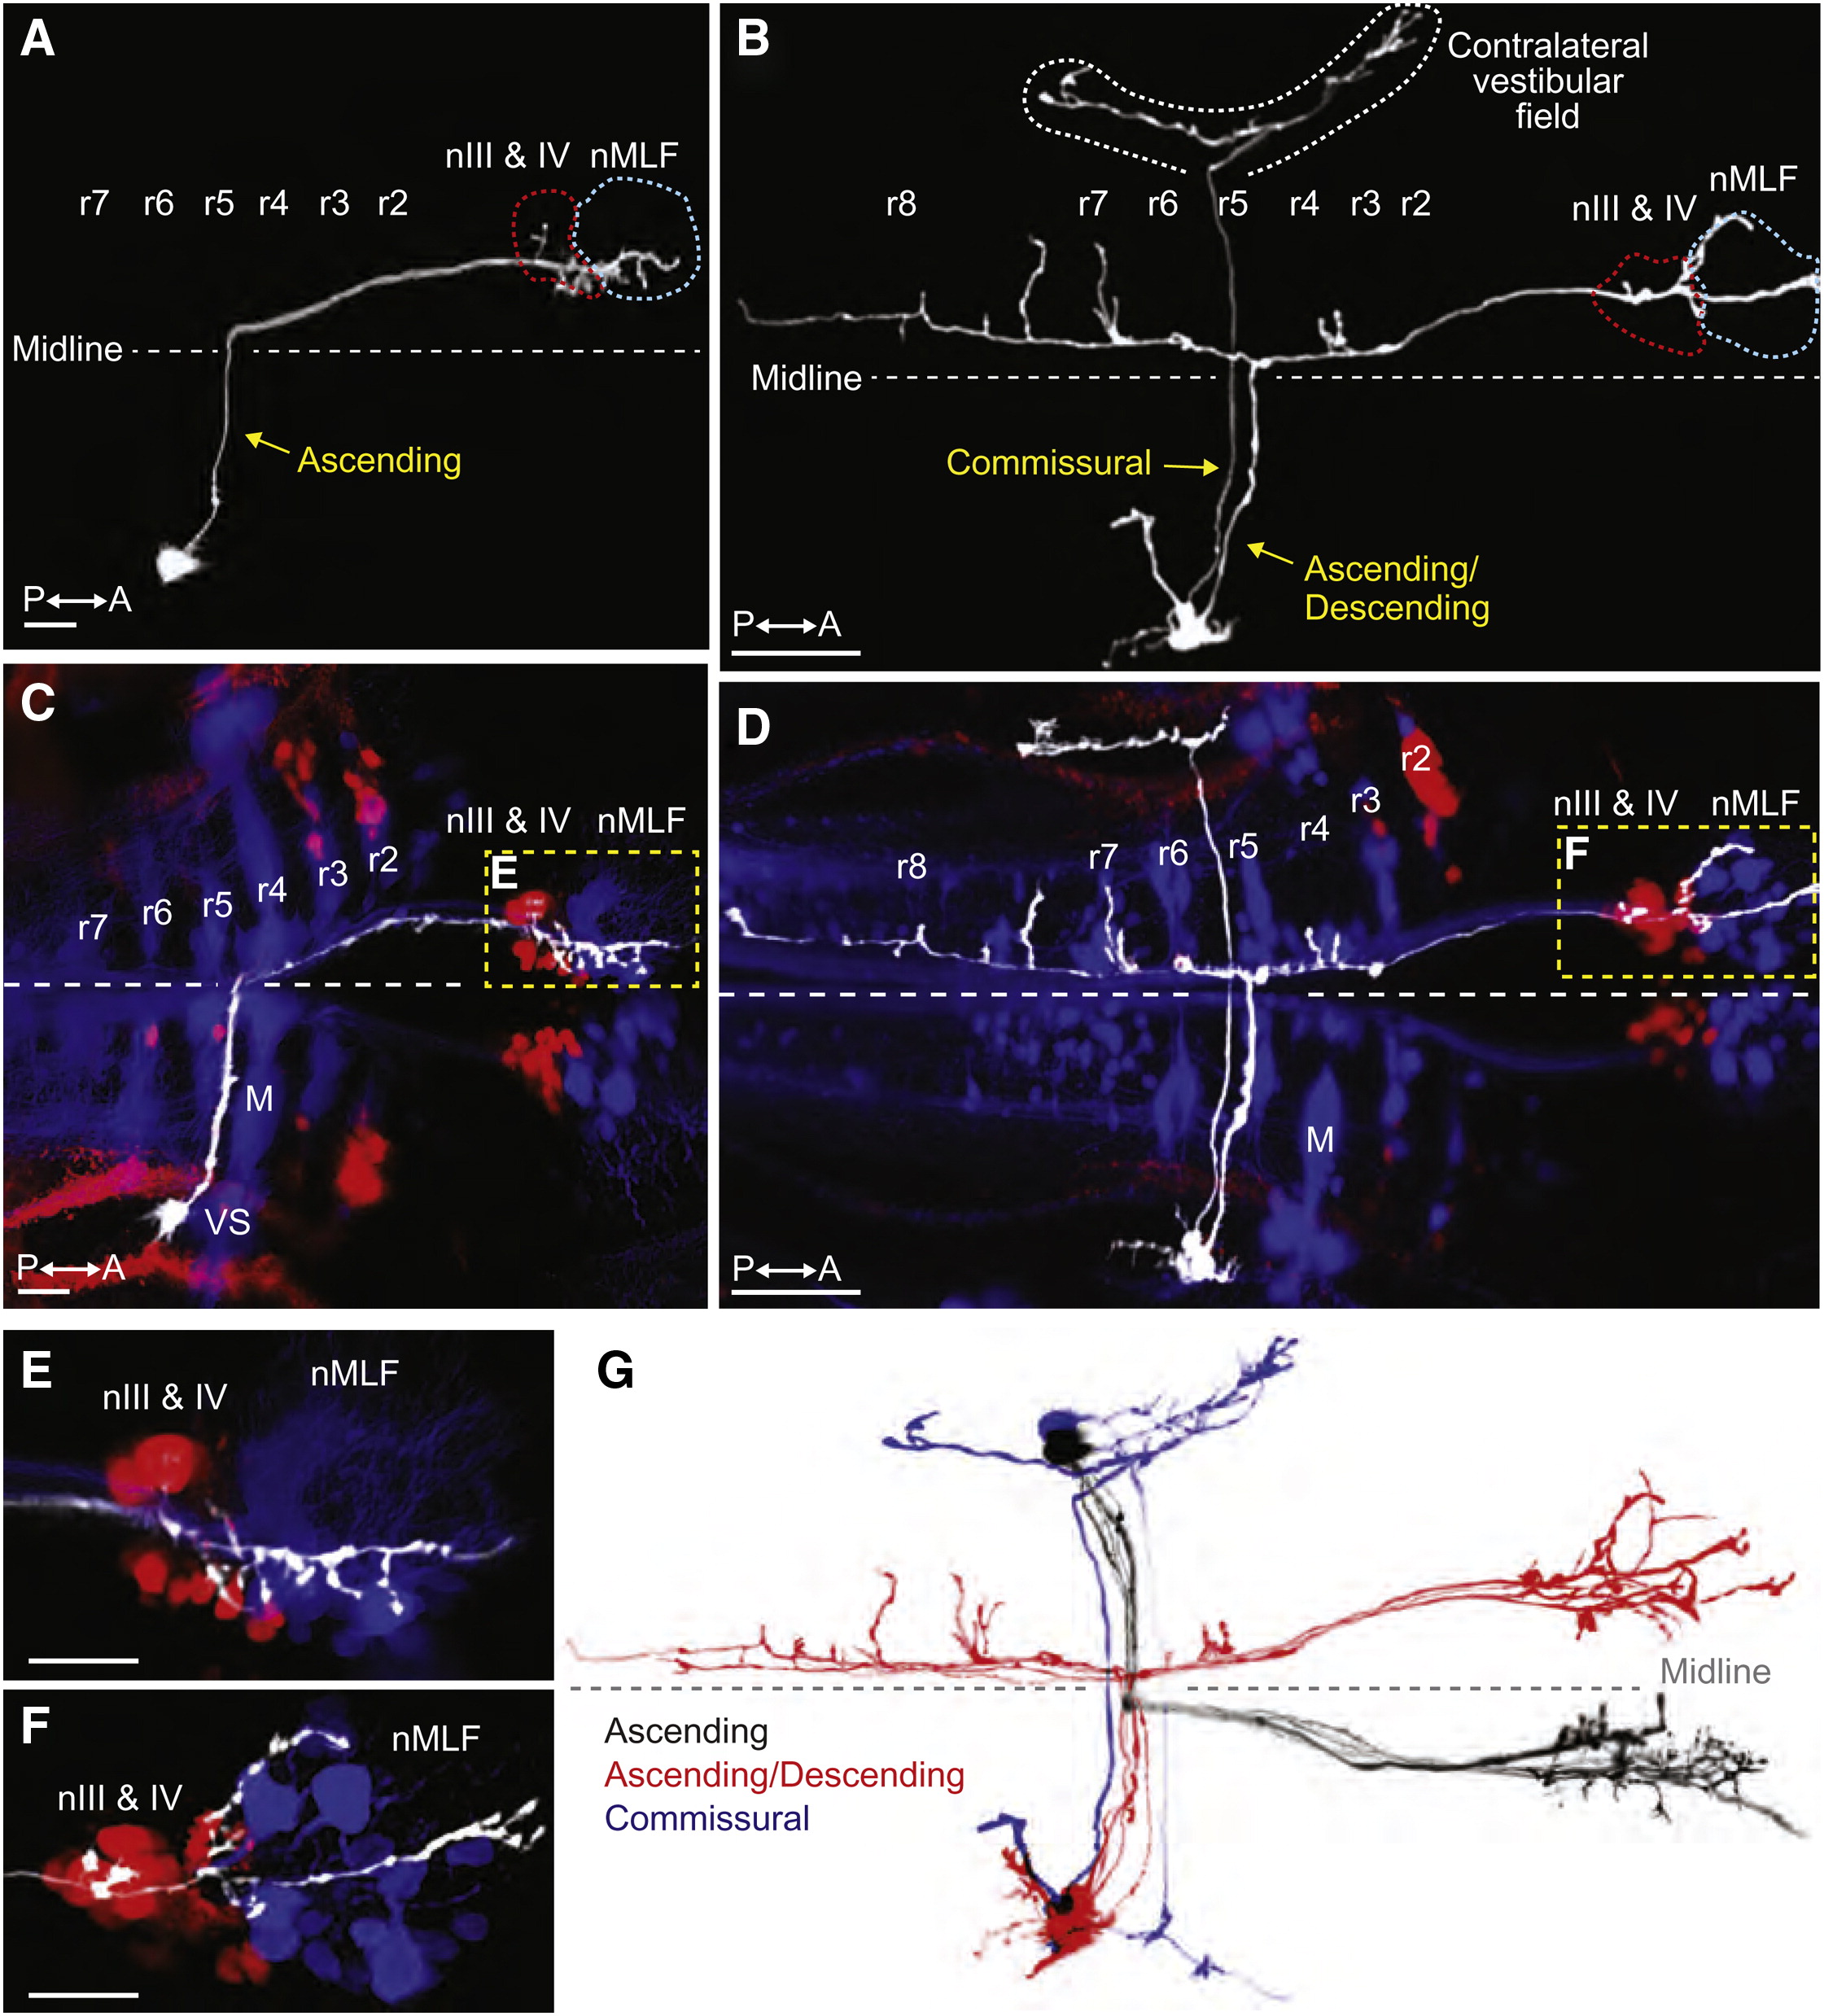
Fig. 4 Tangential Neurons Project from the Octavolateral Hindbrain to Contralateral Extraocular Motoneurons(A and B) Projections of two-photon image stacks showing the morphology of tangential neurons in 6 dpf larvae, which were labeled by focal electroporation.(A) An ascending tangential neuron with a cell body in the right tangential nucleus.(B) An ascending/descending neuron and a commissural neuron, both with soma in the right tangential nucleus.(C–F) Double retrograde labeling of the same larvae shown in (A) and (B). Fluorescent dextrans were applied to the rostral spinal cord to label reticulospinal neurons (blue) and to the orbit to label extraocular motoneurons (red).(C) The cell body of the ascending neuron is visible in lateral rhombomere (r) 5, immediately caudal to the vestibulo-spinal (VS) neurons in r4. M indicates the Mauthner cell. Axon terminal arbors are located in nIII, nIV, and the nucleus of the MLF (nMLF) on the opposite side of the brain, shown at higher magnification in (E).(D) Double retrograde labeling showing the projection patterns of the neurons in (B). The commissural neuron projects to the contralateral vestibular field. The ascending/descending neuron extended axon collaterals into various parts of the reticular scaffold in additional to the rostral arborizations adjacent to the ocular motoneurons and the nMLF (shown at higher magnification in F).(E and F) Higher magnification images of (C) and (D), respectively.(G) Two-photon projections of individual tangential neurons, overlaid and color-coded to show the stereotypical morphology of ascending (black, n = 5), ascending/descending (red, n = 4), and commissural (blue, n = 2) subtypes. Images were manually scaled and aligned to allow comparison of cell morphologies. All of the ascending and ascending/descending neurons projected to ocular motonuclei on the contralateral side of the brain.All images are dorsal views, anterior right. Scale bars represent 10 μm for (A) and (C) and 50 μm for (B) and (D)–(F). See also Figure S4 and Movies S3 and S4.