
Image
|
Figure Caption
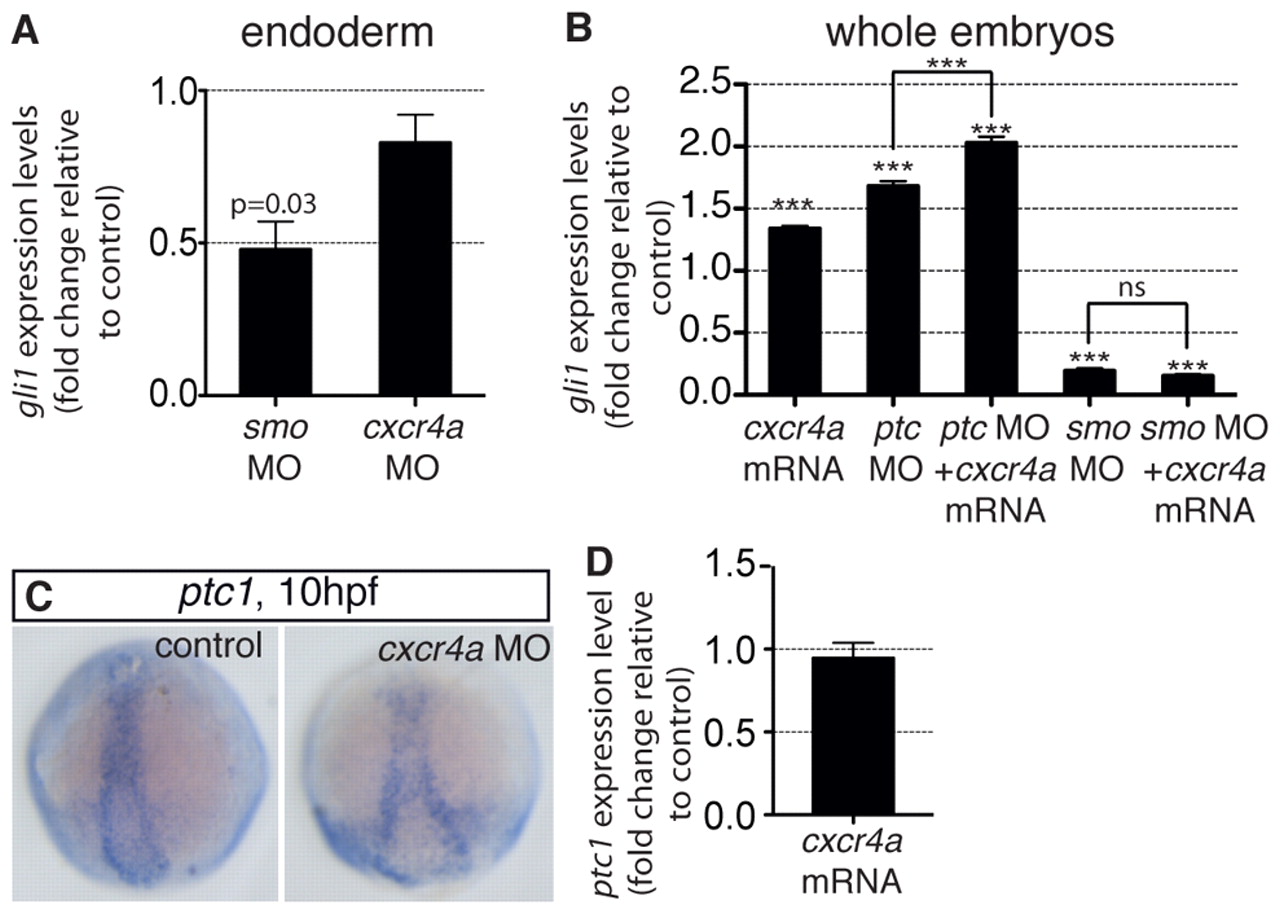
Fig. 5 Cxcr4a promotes gli1 expression. (A) Quantification of gli1 mRNA levels in smo and cxcr4a morphant endoderm relative to control. (B) Quantification of gli1 mRNA levels in whole zebrafish embryos relative to controls. (C) In situ hybridisation for ptc1 in control and cxcr4a morphant embryos at 10 hpf. (D) Quantification of ptc1 mRNA levels in whole embryos (10 hpf) injected with cxcr4a mRNA, relative to control. Bars indicate mean fold change; error bars indicate s.e.m. ***P<0.001; ns, not significant; one-way ANOVA analysis.
Acknowledgments
This image is the copyrighted work of the attributed author or publisher, and
ZFIN has permission only to display this image to its users.
Additional permissions should be obtained from the applicable author or publisher of the image.
Full text @ Development