
|
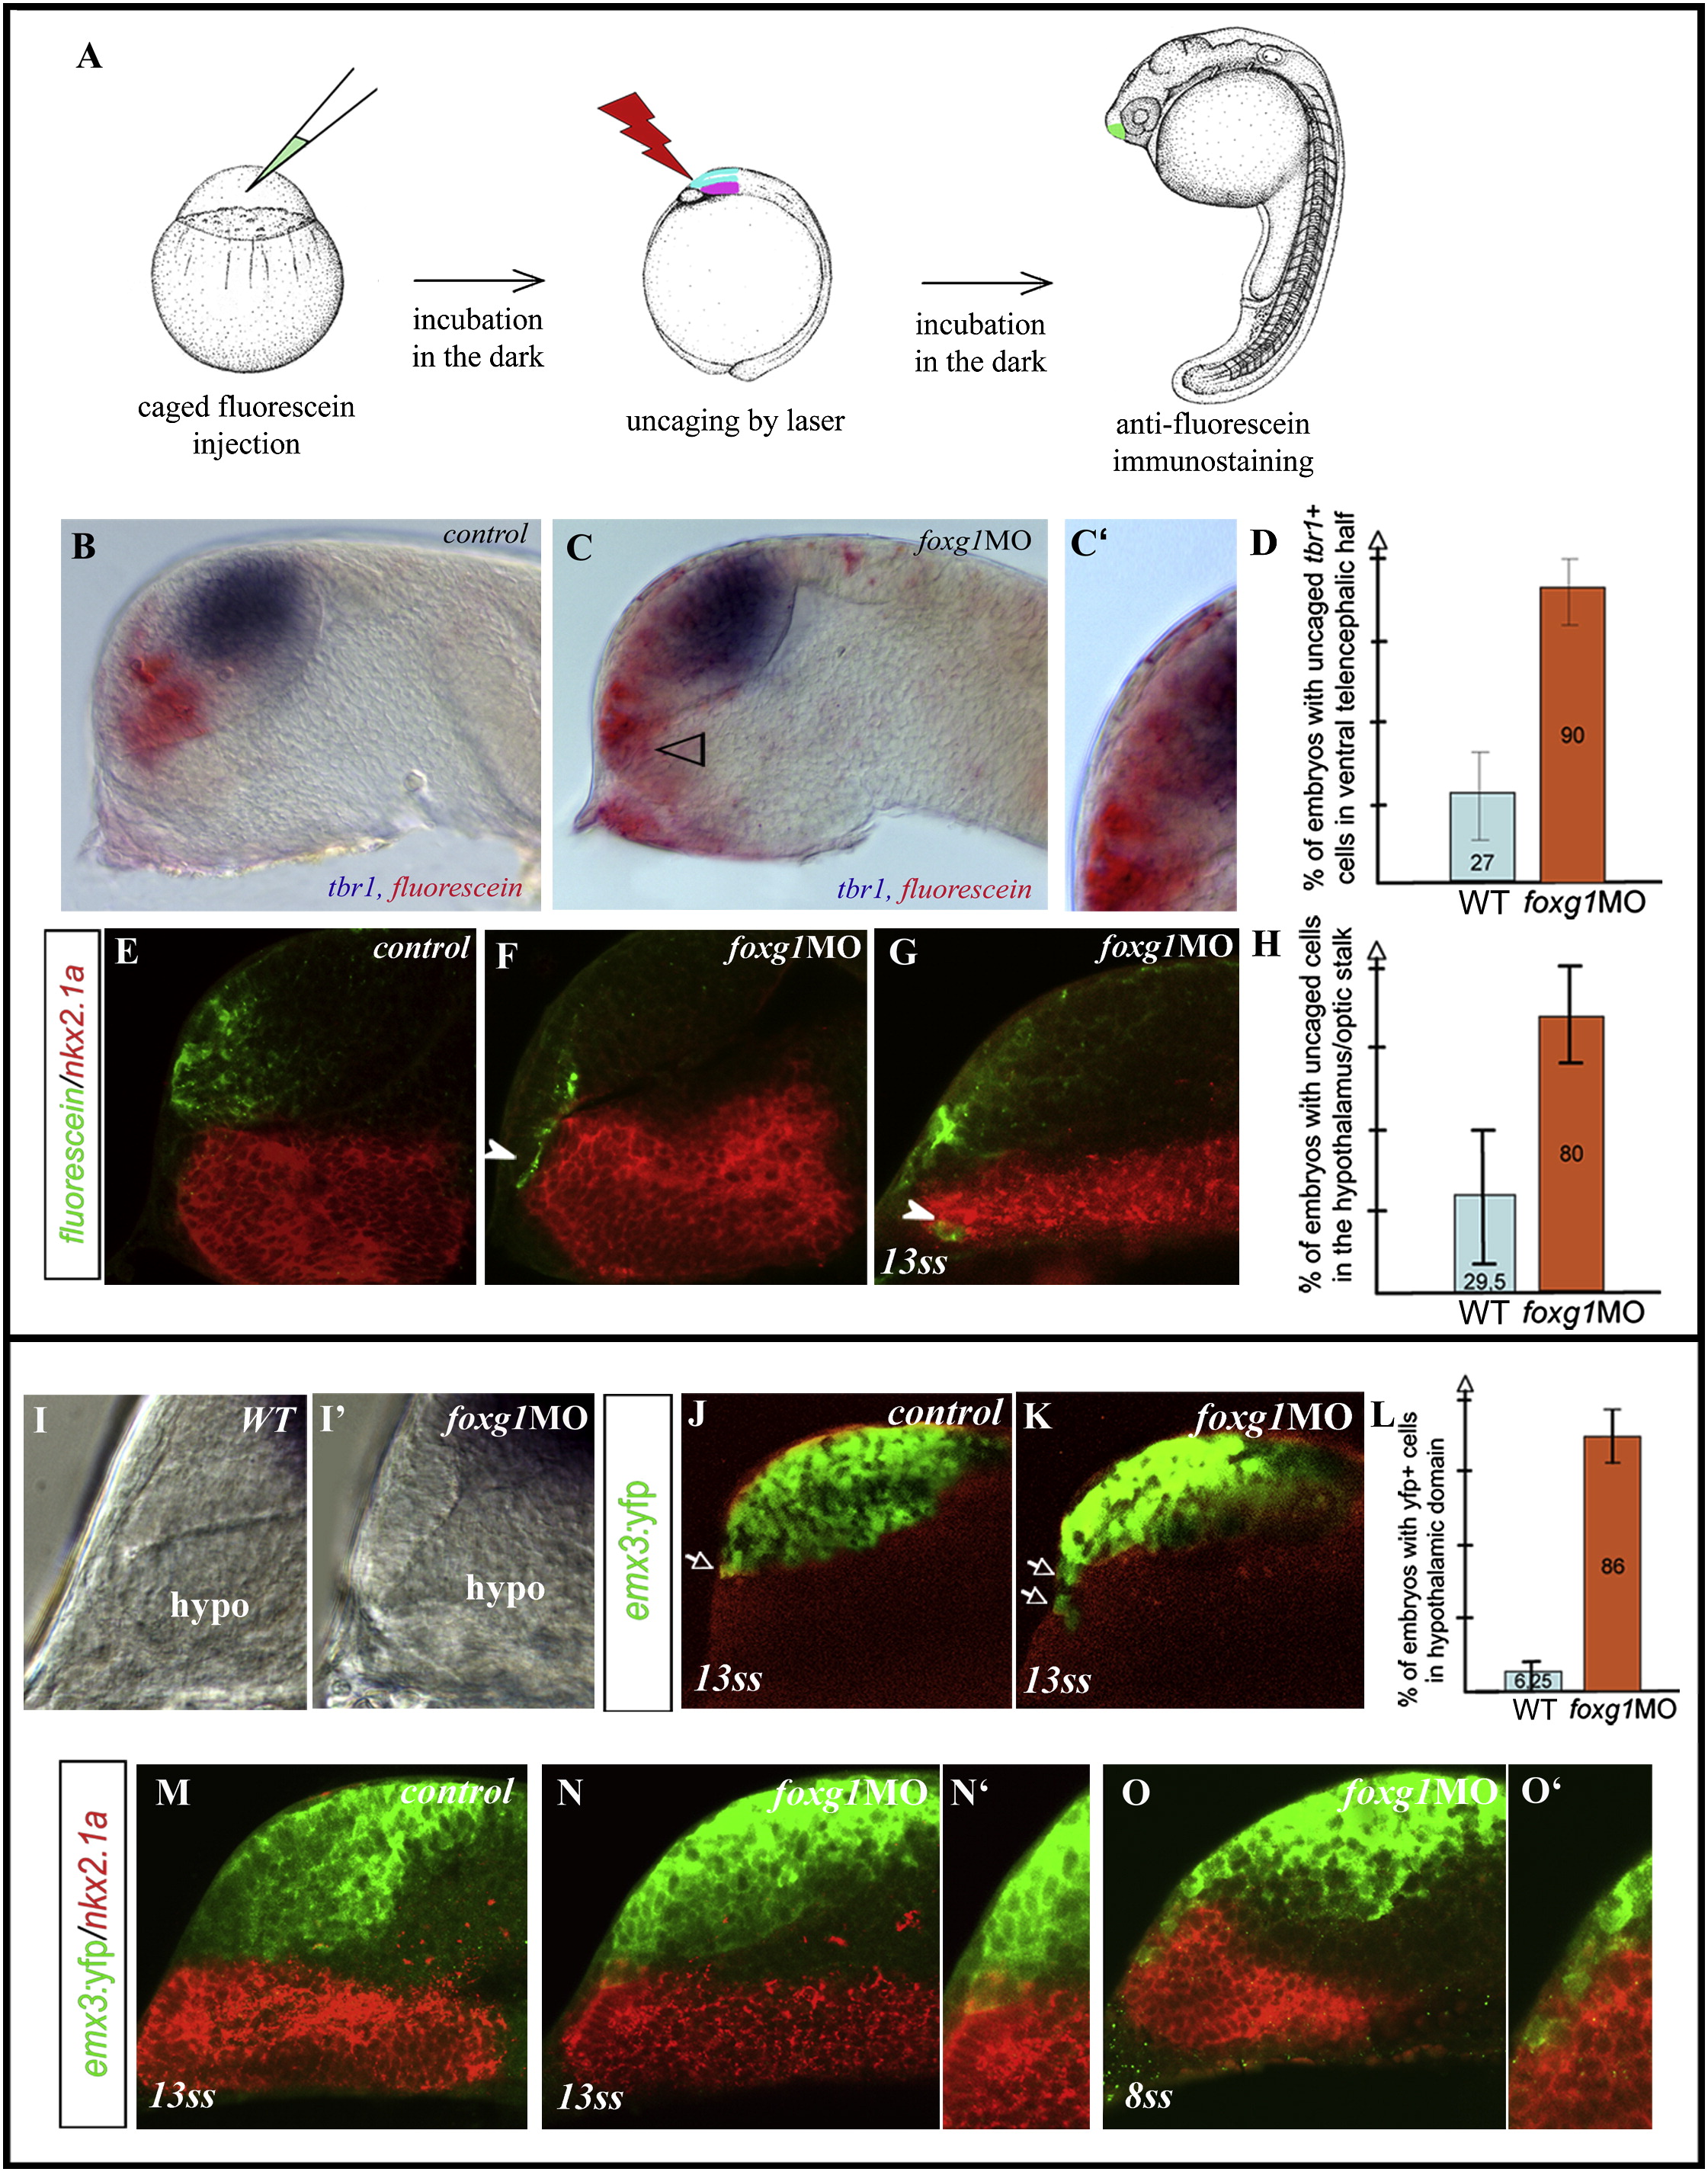
Fig. 3 Prospective Subpallial Precursors Adopt the Pallial Fate or Move into Basal Territory in foxg1 Morphants(A–H) Uncaging experiments. (A) Schematic of the experimental procedure. The telencephalic anlage is indicated in bright blue, and the hypothalamus is indicated in pink. Fluorescein uncaged cells in (B and E) control or (C, F, and G) foxg1MO embryos are detected (in red in [B] and [C] or in green in [E]–[G]) in parallel to (B and C) tbr1 (blue) or (E–G) nkx2.1a (red, confocal sections). The quantification of fluorescein+ cells coexpressing tbr1 in the ventral telencephalon in control or foxg1 morphants with standard deviation is shown in (D). Fluorescein+ cells in the hypothalamus/optic stalk region (arrowheads) are quantified in (H).(I and I2) Close-up of the rostral forebrain by using Nomarski optic in (I) control and (I2) foxg1 morphant embryos.(J–O2) Confocal sections of (M–O′) Tg(emx3:YFP) with YFP in green and nkx2.1a in red, in (J and M) control, or (K, N, and O) foxg1MO embryos. (L) Quantification of YFP+ cells in the hypothalamic domain.
Reprinted from Developmental Cell, 16(4), Danesin, C., Peres, J.N., Johansson, M., Snowden, V., Cording, A., Papalopulu, N., and Houart, C., Integration of telencephalic Wnt and hedgehog signaling center activities by Foxg1, 576-587, Copyright (2009) with permission from Elsevier. Full text @ Dev. Cell