
Image
|
Figure Caption
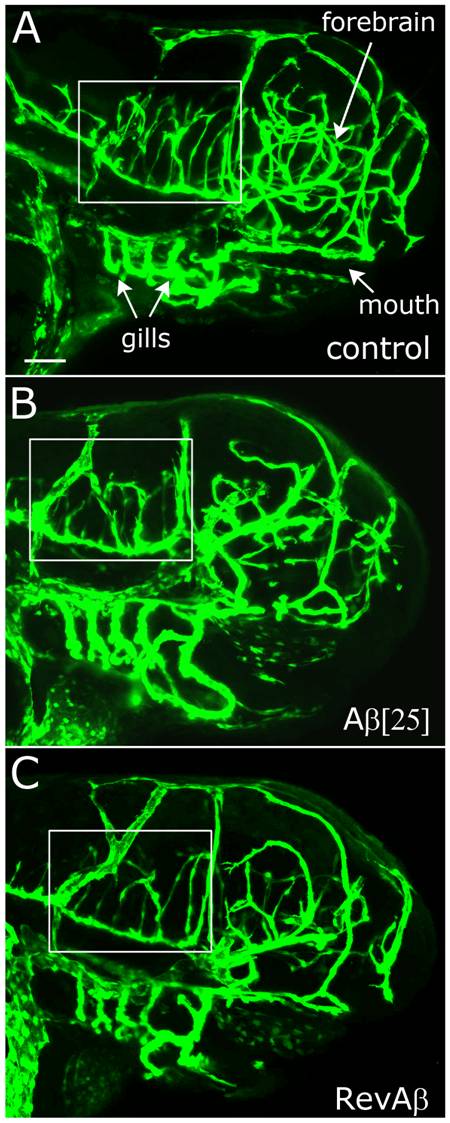
Fig. 3 Morphology and vascular imaging of GFP-expressing zebrafish embryos.
A) Projection image of a 3 dpf embryo using images captured by confocal microscopy. B, C) Comparable projection of a 3 dpf embryo treated with Aβ (25 μg/mL) and Rev Aβ, respectively. Boxes indicate the region analyzed for CtA branching, shown in detail in figure 4. Scale bar = 100 μm, for A–C.
Figure Data
Acknowledgments
This image is the copyrighted work of the attributed author or publisher, and
ZFIN has permission only to display this image to its users.
Additional permissions should be obtained from the applicable author or publisher of the image.
Full text @ PLoS One