
|
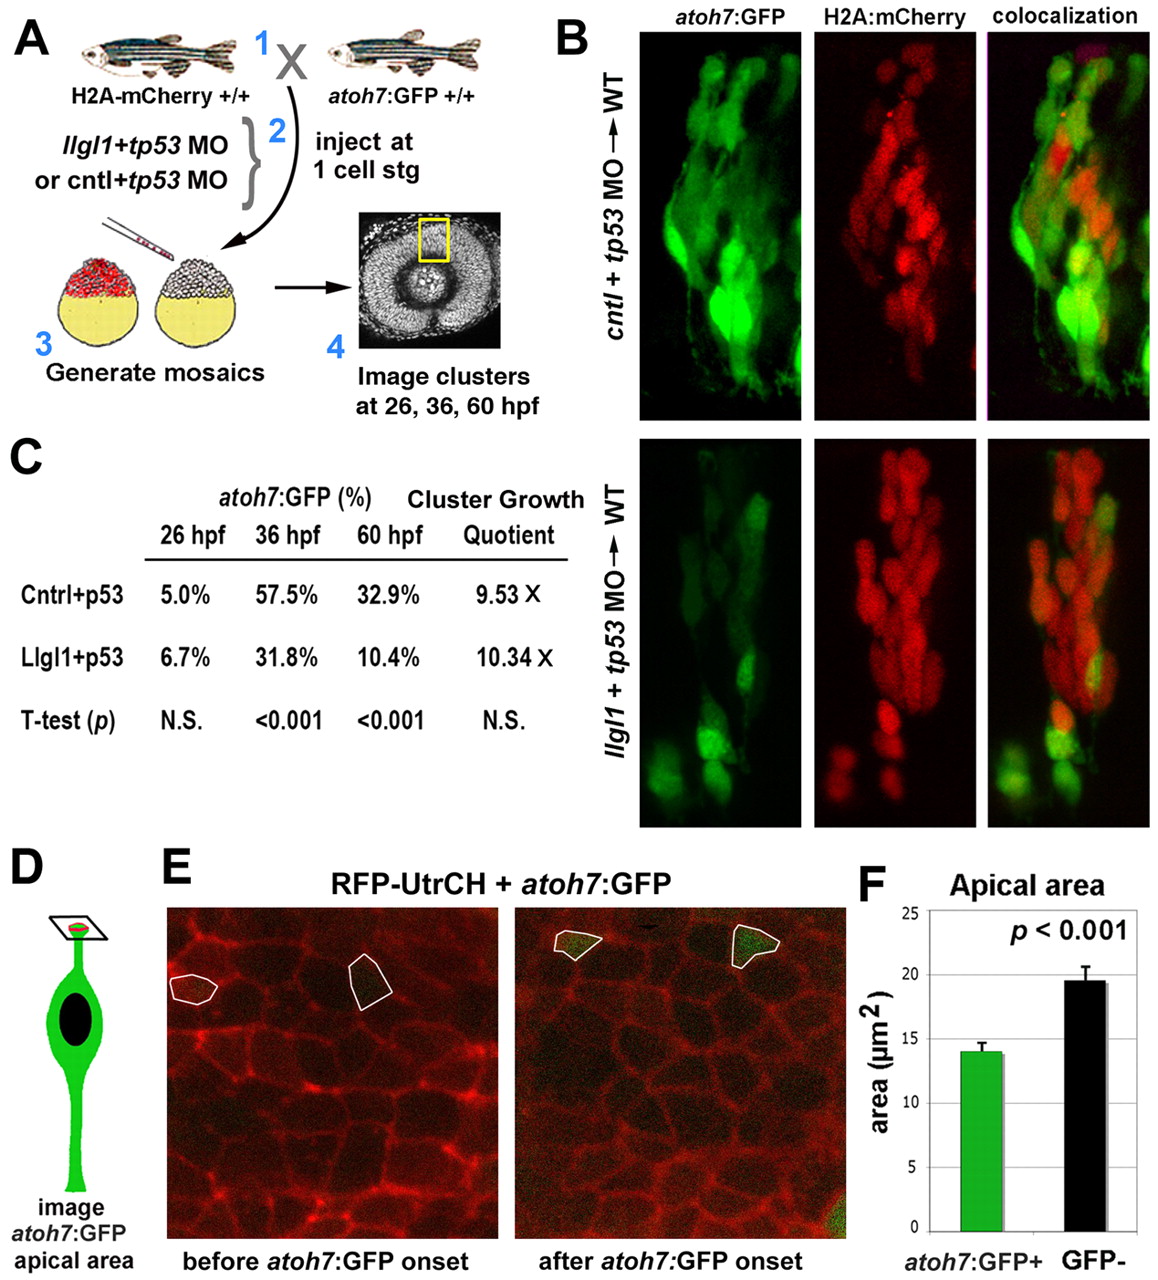
Fig. 5 Neurogenesis is reduced in Llgl1-deficient retinal neuroepithelia. (A) Experimental design for evaluating neurogenesis in morphant retinal cells in wild-type host eyes. (B) Confocal images of donor cells showing atoh7:GFP (green, left panels), H2A-mCherry (red, middle panels) and combined images (right panels) at 36 hpf. Donor cells were derived from embryos injected with either 8 ng control+ 8ng tp53 MO (top) or 8 ng tp53 + 8ng llgl1 ATG MO (bottom). (C) Comparison of the proportion of atoh7:GFP-positive cells in control or llgl1 morphant clusters (n>10 clusters from 10 chimeras for each condition) tracked at 26, 36 and 60 hpf. Cluster Growth Quotient indicates the fold expansion of the cluster cell number [(60 hpf cell number–26 hpf cell number)/26 hpf cell number]. (D) Image plane used to measure apical area. (E) Confocal images of retinal neuroepithelial apical domains prior to atoh7:GFP expression (segmented areas, left) and just after GFP became detectable (right). Apical junctions are labeled by injection of RFP-UtrCH mRNA (red) (F) Comparison of the apical area of cells prior to atoh7:GFP (green bars, n=21 cells) expression and cells that did not go on to express GFP (black bars, n=35 cells). Error bars represent s.e.m.; P, Student’s t-test.