
|
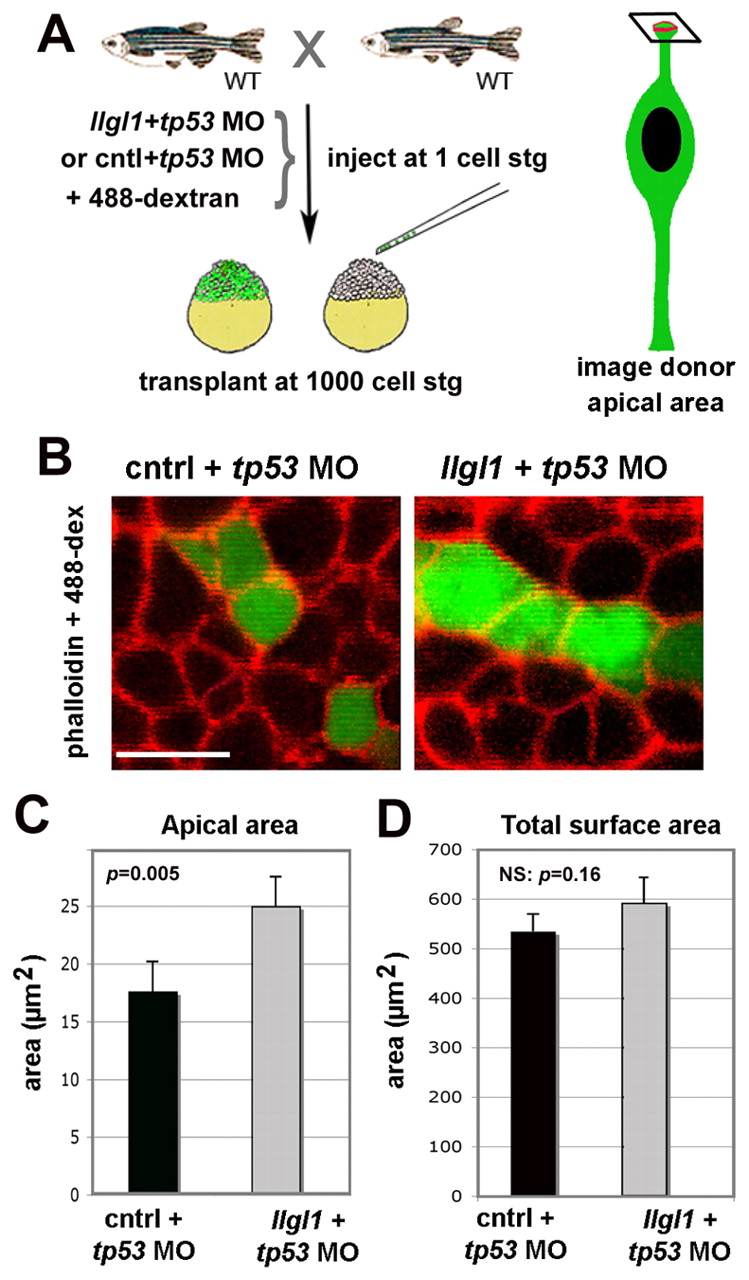
Fig. 4 Apical domain expansion in Llgl1-deficient retinal neuroepithelia. (A) Schematic showing the experimental design for evaluating apical domain of morphant retinal neuroepithelia in wild-type host eyes. (B) Confocal image of the apical surface area of retinal neuroepithelial endfeet. Donor cells (green) were derived from embryos injected from either 8 ng control+ 8ng tp53 MO (left) or 8 ng tp53 + 8ng llgl1 ATG MO (right). Chimeric embryos were fixed at 34 hpf and stained for rhodamine-phalloidin (red). (C) Comparison of the apical surface area between control (black bars) and llgl1 morphant (gray bars) cells (n=22 cells each from six control MO or 5 llgl1 MO chimeras). (D) Comparison of the total surface area between control (black bars) and llgl1 morphant (gray bars) cells (n=25 cells each from three control MO or three llgl1 MO retinas). For D and E, error bars represent s.e.m.; P, Student’s t-test; NS, not significant. Scale bar: 10 μm in B.