
|
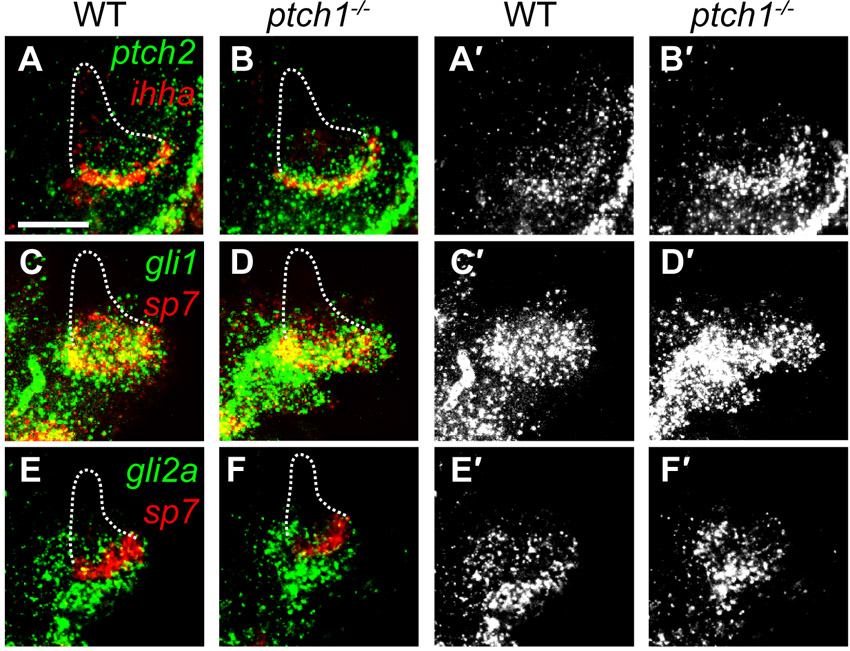
Fig. S3 Targets of active Hh signaling are upregulated in ptch1 mutants. Confocal projections showing Hh pathway gene expression at 5 dpf by whole-mount fluorescent in situ hybridization. Images show expression of genes relative to ihha or sp7 (A-H) and a separated channel with individual gene expression (A′-F′) from respective images. (A-D2) Expression of ptch2 and gli1 is upregulated along and ventral to the vp edge in ptch1 mutants, but not along other bone edges. (E-F′) Expression of gli2a appears unchanged in ptch1 mutants. Dashes represent the outline of the other Op edges. Images are representative of ne11 mutants and an equivalent number of wild-type siblings per label. Scale bar: 50μm.