
|
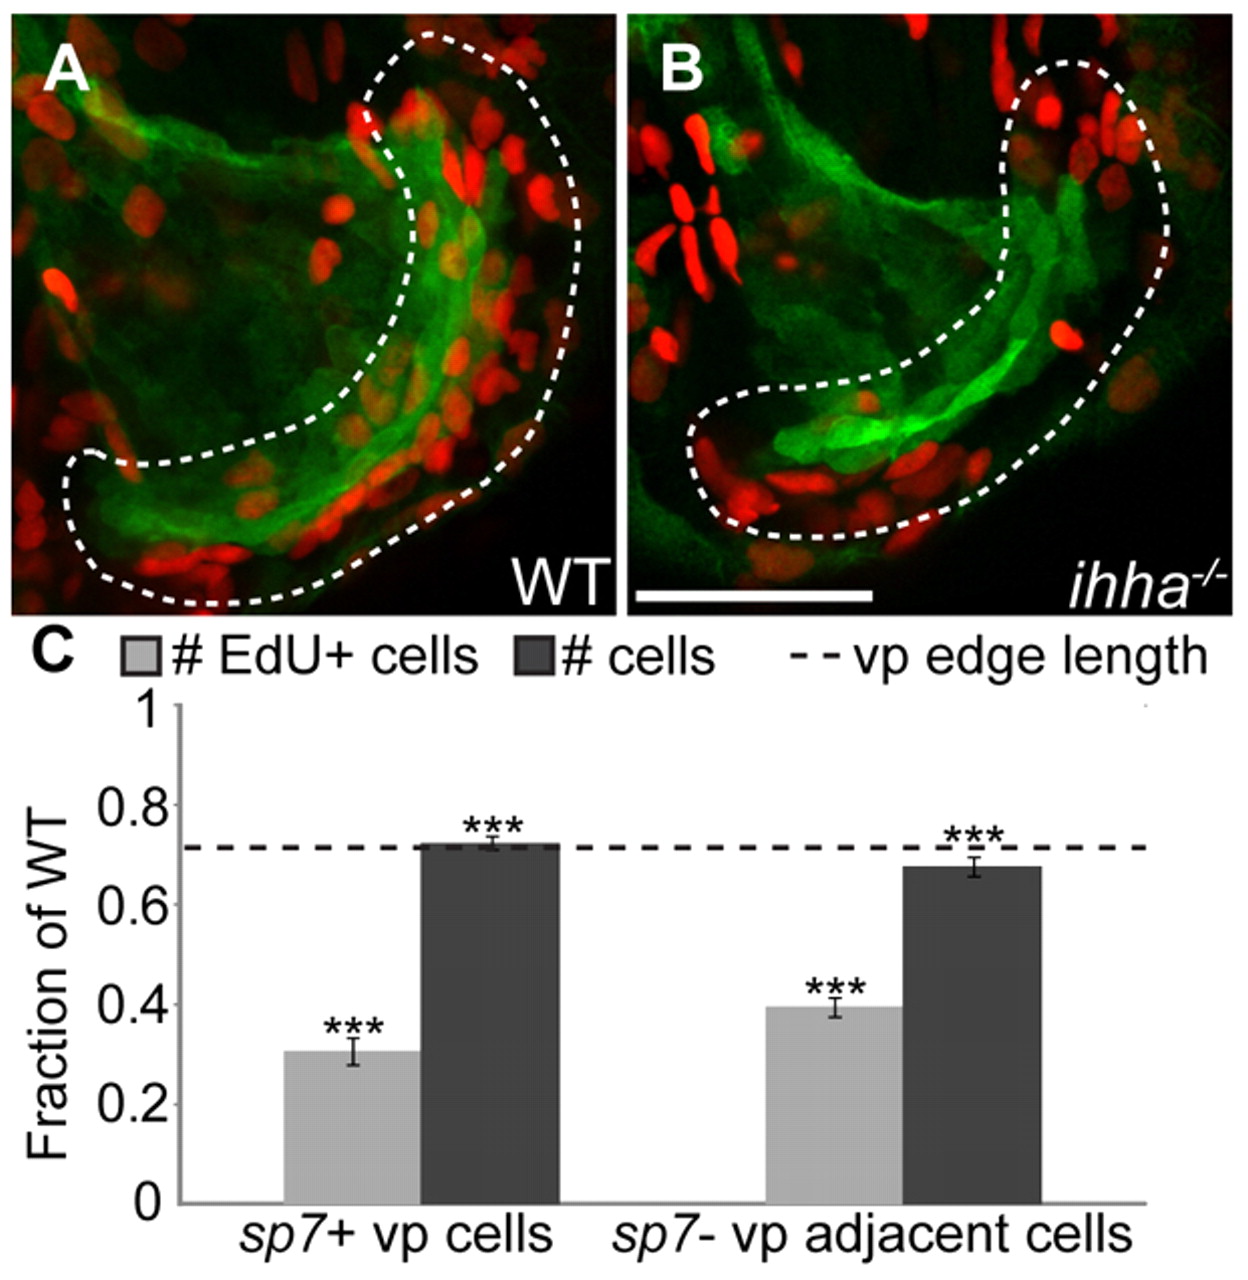
Fig. 4 ihha controls cell proliferation. Quantitation of cell proliferation in ihha mutants and wild-type siblings. Images are lateral views with dorsal upwards and anterior towards the left. (A,B) Confocal projections of the Op at 5 dpf showing sp7:EGFP-expressing osteoblasts (green) and EdU-positive (EdU+) cells (red). (A) EdU+ cells are mostly found along the actively growing vp edge in wild type. (B) Fewer EdU+ cells are apparent along the vp edge in ihha mutants. Scale bar: 50 μm. (C) Quantitation of EdU+ cells along the vp edge as a fraction of wild-type levels shows that the amount of EdU+ cells is significantly decreased in ihha mutants. Cells included in the count, represented by dashes in A and B, are those within two cell diameters of the vp edge that express sp7:EGFP (sp7+ vp cells) or those that do not (sp7–, vp adjacent cells). The number of total cells stained with SYTO-59 was counted with the same parameters in a separate experiment and is decreased to a lesser extent than the number of EdU+ cells, but proportional to the decrease in vp edge length (shown as a broken line and based on Fig. 3). Data are presented as mean±s.e.m., ***P<0.001 by unpaired t-test, ne10 per genotype.