
|
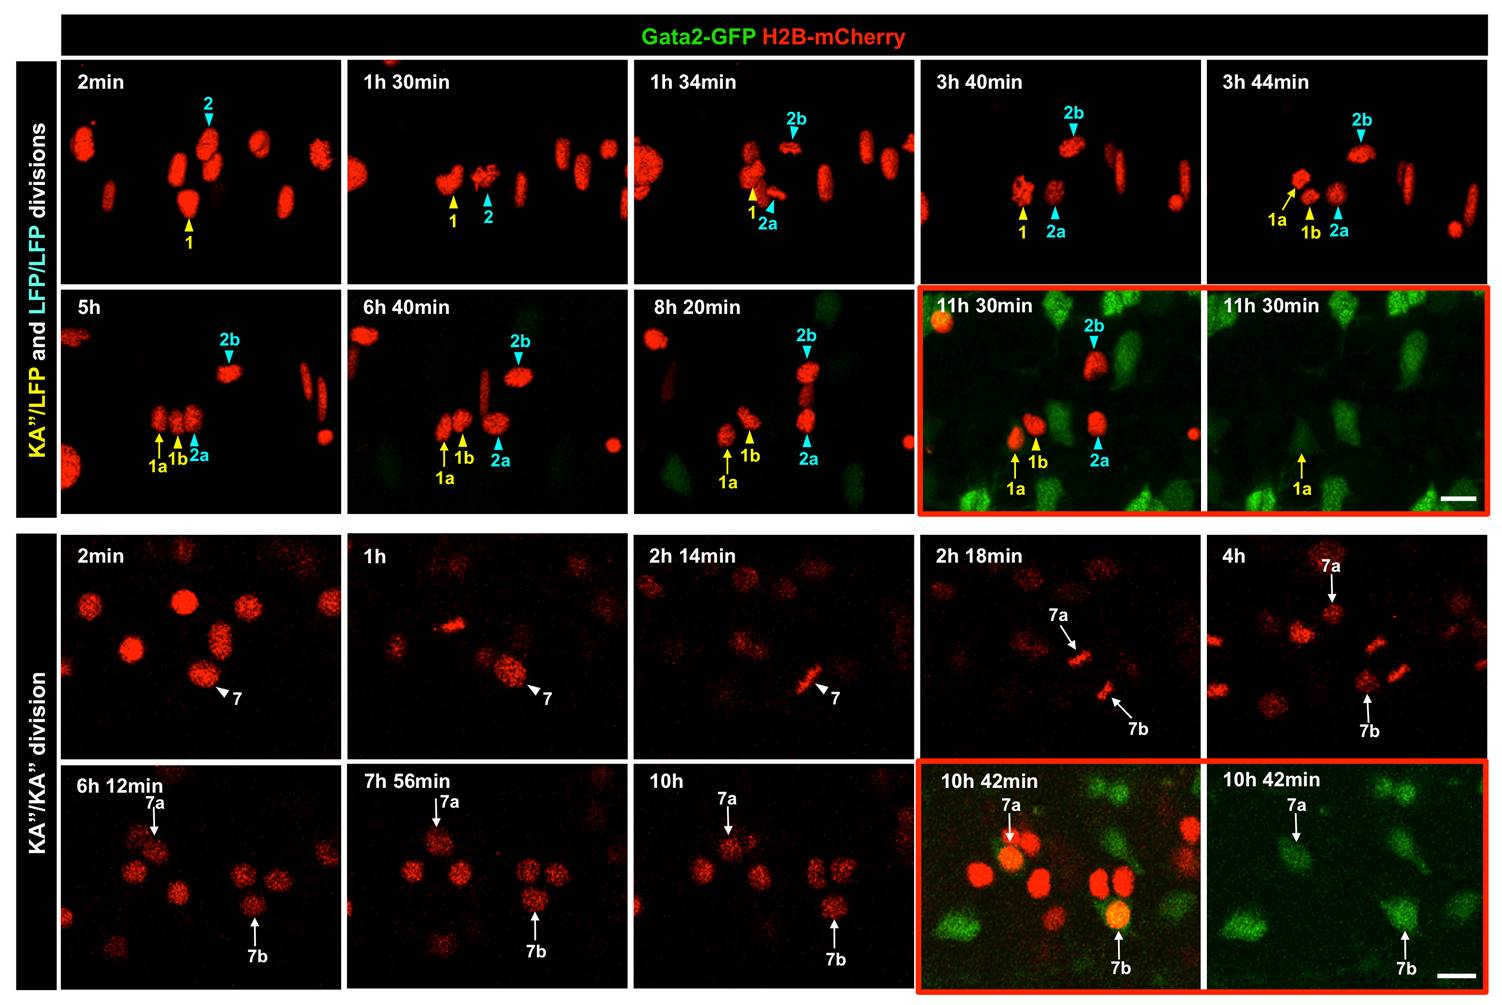
Fig. S1 Time-lapse imaging reveals different division patterns in the LFP domain. The top panel corresponds to the time-lapse sequence of the region containing cell 1, cell 2 and their daughter cells in Figure 2C and Video S1. Each frame is a projection of confocal slices containing cells of interest. The green channel was switched on after 6.5 hours. The bottom panel shows the time-lapse sequence of the region containing cell 7 in Figure 2C. Each frame corresponds to a single optical slice containing cells of interest. The green channel was switched on at the last time point. KA′′ cells and LFP cells are denoted by arrows and arrowheads, respectively. Cell 1, 2, and 7 undergo KA′′/LFP, LFP/LFP, and KA′′/KA′′ divisions, respectively. The time point of each frame is indicated on top. For the final time point, both the merged image and the image with the green channel alone are shown (red boxes). Scale bars: 10 μm.