
|
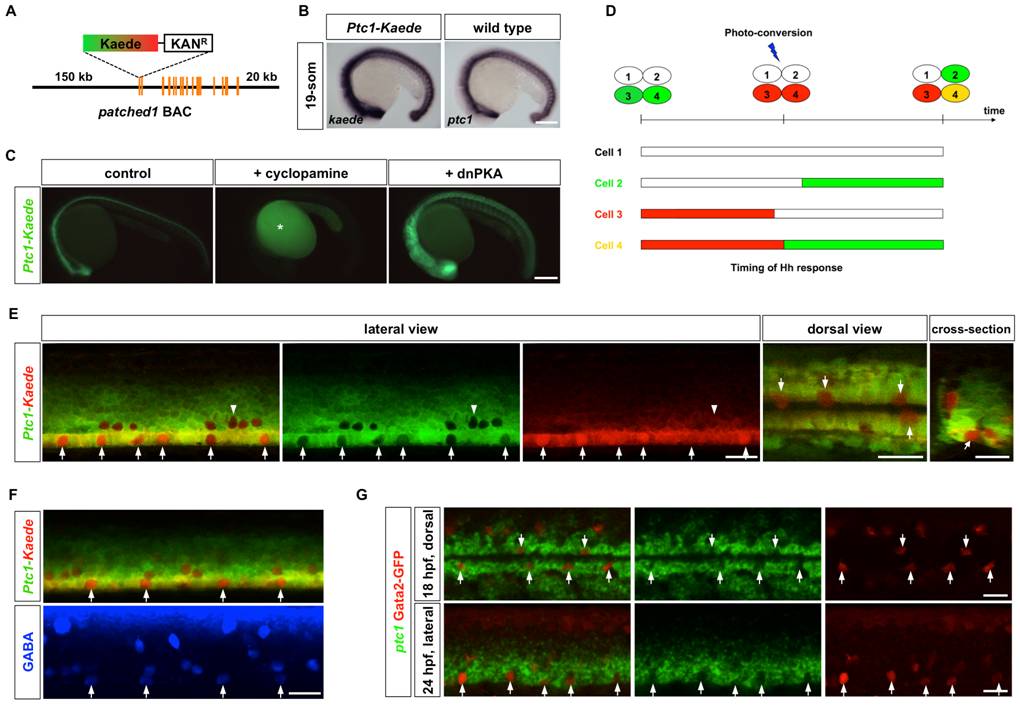
Fig. 3 Temporal profiles of Hh response visualized by a Ptc1-Kaede reporter.
(A) Schematic drawing of the Ptc1-Kaede BAC reporter. A cassette containing Kaede and Kanamycin resistant gene was recombined to replace the first exon of ptc1. (B) Ptc1-Kaede fish showed kaede expression in a pattern similar to the expression of ptc1 in wild type embryos at 19-som stage. (C) Inhibition of Hh signaling using cyclopamine blocked Ptc1-Kaede expression, while overexpression of dnPKA mRNA induced ectopic expression of the transgene. Fluorescent signal in cyclopamine-treated fish is due to auto-fluorescence of the yolk (asterisk). (D) Schematic drawings of PHRESH analysis. Photoconversion of the Ptc1-Kaede reporter can be used to determine the timing of Hh response (see text for details). (E) Ptc1-Kaede fish were photoconverted at 25 hpf, and imaged at 36 hpf. Single optical sections of a lateral view, dorsal view, and cross-section are shown. Arrows indicate Ptc1-Kaedered cells in the lateral floor domain. Note that dorsally located KA2 cells also only express Ptc1-Kaedered (arrowheads). (F) Ptc1-Kaede fish were photoconverted at 24 hpf, and stained with the GABA antibody (blue) at 35 hpf. Arrows indicate GABA-positive KA3 cells. (G) Gata2-GFP fish were co-labeled with ptc1 (green), and the GFP antibody (red). Images shown are the dorsal view of an 18 hpf embryo (top) and the lateral view of a 24 hpf embryo (bottom). KA′′ cells are indicated by arrows. Scale bars: 200 μm in B–C and 20 μm in E–G.