
|
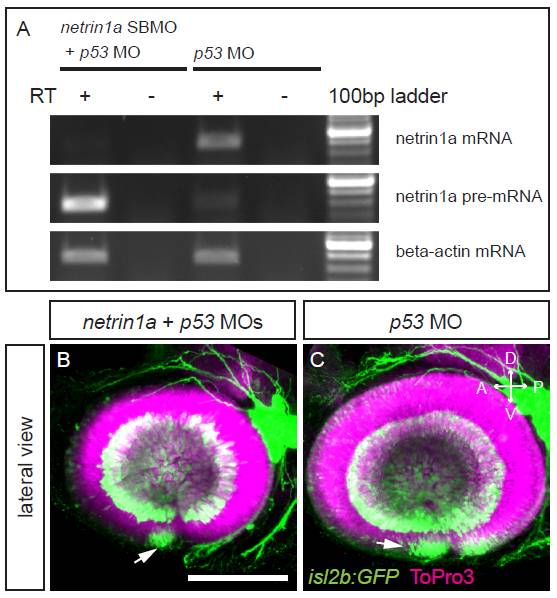
Fig. S2 Normal intraretinal axon pathfinding in netrin1a morphants. (A) Reverse-transcription PCR showing knockdown of properly spliced netrin1a mRNA in netrin1aSBMO and p53MO co-injected embryos compared with p53MO control-injected embryos. Middle band, unspliced pre-mRNA levels are increased in netrin1aSBMO-injected embryos compared with control. Bottom band, beta-actin mRNA levels serve as loading control. (B,C) Maximum-intensity confocal projections of lateral views at 2 dpf. netrin1aSBMO and p53MO co-injected embryos (B) and p53 control morphants (C) show normal intraretinal axon pathfinding, whereas eye size is decreased in netrin1a morphants compared with control embryos. Photoreceptor differentiation is visible in both netrin1a morphants and controls (arrows). isl2b:GFP (green); nuclei, ToPro3 (magenta). Scale bar: 100 μm.