
|
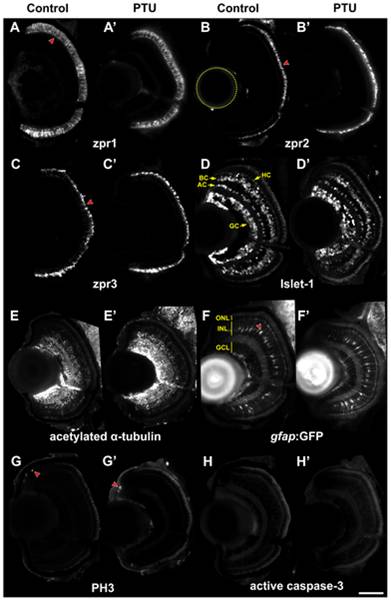
Fig. 3 Immunohistochemical analysis of zebrafish eyes before and after PTU treatment.
Immunostaining was conducted on 10-μm-thick cryosections of PTU-treated and control larvae at 4 dpf with the following first antibodies: (A & A′) anti-zpr1 for cones (red arrowhead), (B & B′) anti-zpr2 for RPE (red arrowhead), (C & C′) anti-zpr3 for rods (red arrowhead), (D & D′) anti-Islet1 for GCs, ACs, BCs and HCs, (E & E′) anti-acetylated α-tubulin for the axons of differentiated neurons, (G & G′) anti-PH3 for mitotic cells (red arrowheads) and (H & H′) anti-active caspase3 for apoptotic cells. (F & F′) MCs were visualized by cryosectioning of a transgenic fish Tg(gfap:GFP)mi2001 treated with PTU in the same manner. The cell bodies were visualized by green fluorescence (red arrowhead). All positive signal areas or cell counts were extracted and normalized by retinal area, which was traced in the channel with DAPI nuclei stain. There are no differences in staining of any markers between the PTU-treated and control groups except for zpr2, in which the positive signal/ retinal area was larger in the PTU-treated group. All images are transverse sections; the lens is on the left (the location is indicated by a dotted yellow circle in (B)) and dorsal is up. The approximate retinal cell layers and cell types are indicated in (D) and (F). Scale bar = 50 μm.