
|
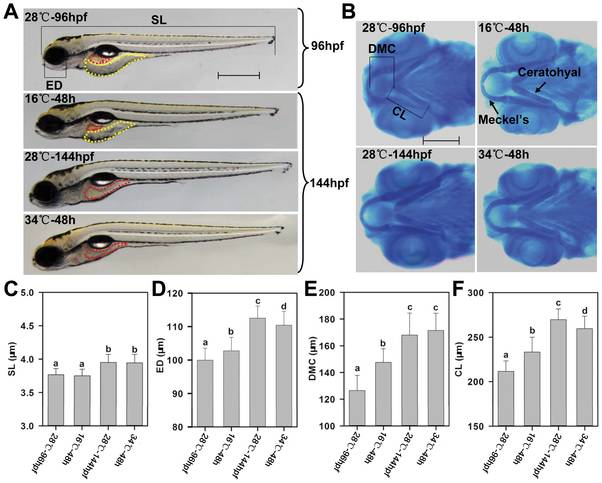
Fig. 2 Effects of temperature stress on the development of zebrafish larvae.
(A) Representative images of zebrafish larvae before and after temperature stress. Zebrafish larvae at 96 hpf (maintained at 28°C from fertilization) were exposed to temperature stress for 48 h (cultured at 16, 28 or 34°C from 96 to 144 hpf). Images were taken under a stereomicroscope from Zeiss with a color CCD camera. Red and yellow dashed line indicates intestine lumen and yolk sac, respectively. SL: standard length (distance from the snout to the posterior tip of the notochord). ED: eye diameter. Scale bar: 500 μm. (B) Alcian blue staining of the cartilages of jaw and branchial arches. DMC: distance from the inner border of Meckel’s cartilage to the anterior end of ceratohyal. CL: ceratohyal length. Scale bar: 200 μm. (C, D, E and F) Bar charts demonstrate the effect of temperature stress on the SL, ED, DMC and CL, respectively. Horizontal axis indicates treatments described in (A) and (B). Error bars indicate standard deviations (n = 40–60). Different letters above the error bars indicate statistically significant differences determined by one-way analysis of variance (ANOVA) followed by Duncan’s multiple range test (p<0.05).