
|
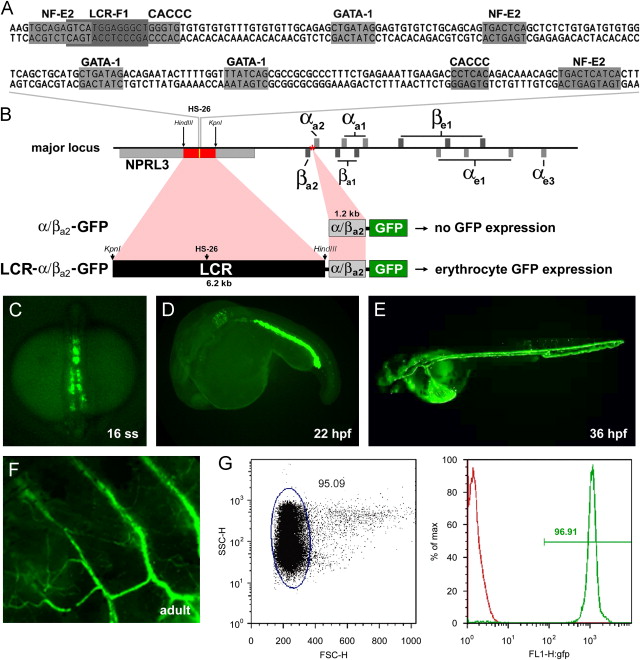
Fig. 5 Generation and characterization of LCR-GFP transgenic zebrafish line: (A) sequence and location of the HS-26 DNase I hypersensitivity site (HS-26; yellow rectangle) and locus control region (LCR; red rectangle) within the major globin locus. The proximal globin promoter used is indicated with a red star. Shaded boxes indicate binding motifs for canonical erythrocyte transcription factors. (B) Representation of the vectors assembled from genomic fragments and the resulting GFP expression patterns. Fluorescent images of LCR-GFP transgenic zebrafish embryos at 16ss, 22 hpf and 36 hpf respectively (C–E). (F) Fluorescent image of the flank of an adult LCR-GFP transgenic zebrafish. (G) Red blood cell gate as determined by forward and side scatter for peripheral blood, and the analysis of the percent of GFP positive red blood cells in an LCR-GFP transgenic adult (green) versus in a wild-type adult (red). (For interpretation of the references to colour in this figure legend, the reader is referred to the web version of this article.)
Reprinted from Developmental Biology, 366(2), Ganis, J.J., Hsia, N., Trompouki, E., de Jong, J.L., Dibiase, A., Lambert, J.S., Jia, Z., Sabo, P.J., Weaver, M., Sandstrom, R., Stamatoyannopoulos, J.A., Zhou, Y., and Zon, L.I., Zebrafish globin switching occurs in two developmental stages and is controlled by the LCR, 185-194, Copyright (2012) with permission from Elsevier. Full text @ Dev. Biol.