
|
Fig. 4
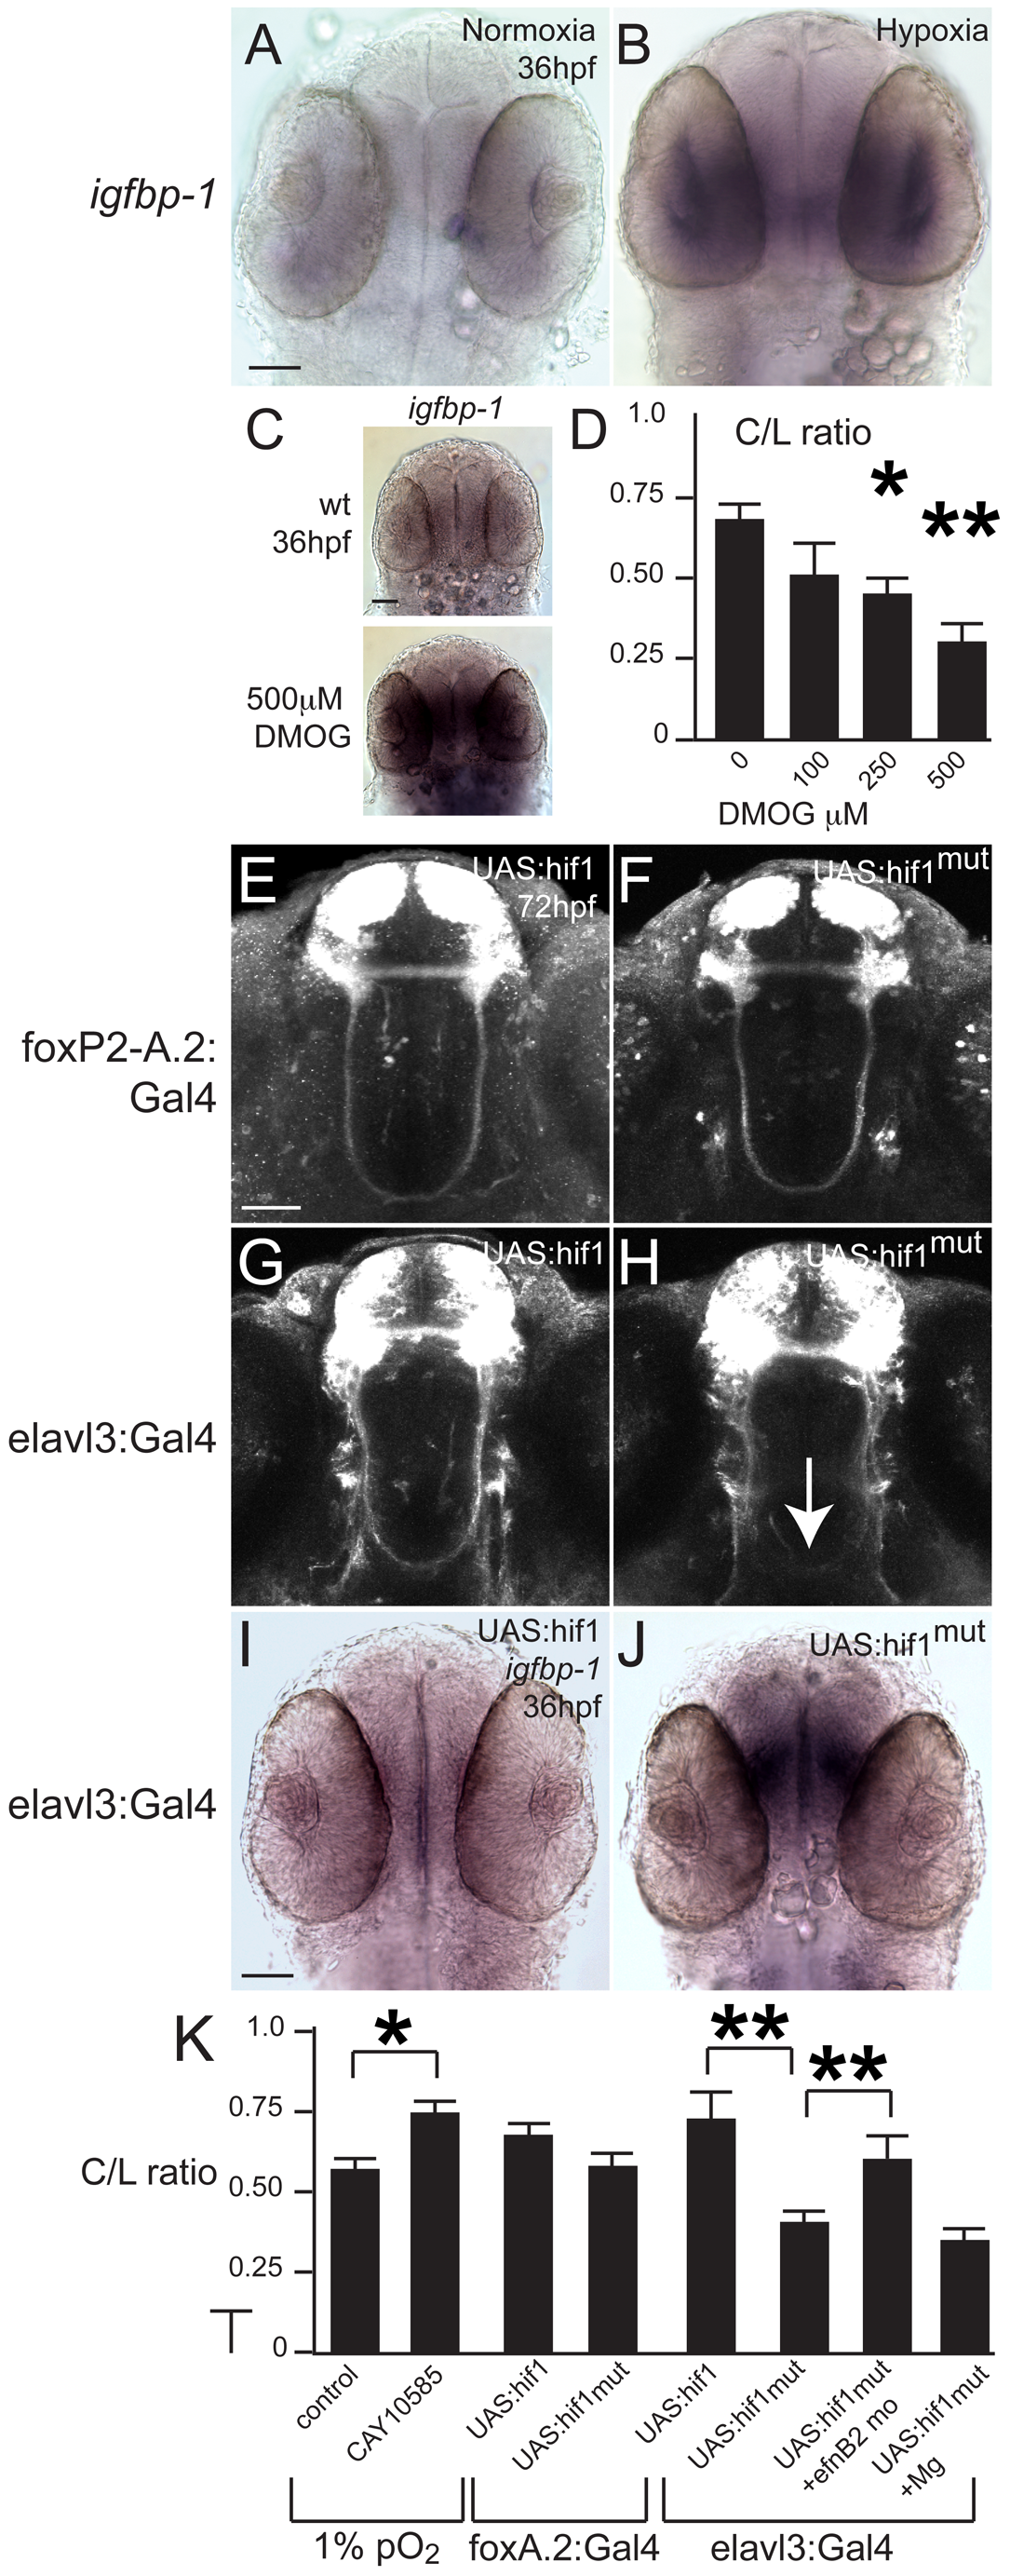
Developmental hypoxia induces the hif1 pathway and disrupts pathfinding via a non-cell autonomous mechanism.
Whole-mount embryos, 36 hpf, ventral views, rostral to the top, scale bar 50 μm. Images are brightfield views. (A, B) Staining for the igfbp-1 gene activated by hypoxia shows that hypoxia effectively induces the hif1 pathway. (C) DMOG activates the hif1 pathway, as shown by increased igfbp-1 expression at 36 hpf following DMOG exposure from 24–36 hpf. (D) Increasing DMOG concentration from 24–36 hpf leads to increased rates of TCPTc pathfinding errors, assayed by C/L ratios. *p<0.05; ** p<0.005. Error bars SEM. (E–H) Confocal images, 72 hpf, ventral views, rostral top. (E, F) Normal TCPT pathfinding when hif1α or activated hif1αmut is expressed in foxP2 neurons. (G, H) Expression of hif1αmut, but not hif1α, disrupts TCPT pathfinding when expressed in neighboring neurons. (I, J) Expression of hif1αmut, but not hif1α, leads to activation of the hypoxia pathway as assayed by igfbp-1 expression. (K) C/L intensity ratios of experiments. *p<0.05; ** p<0.005. Error bars SEM.