
|
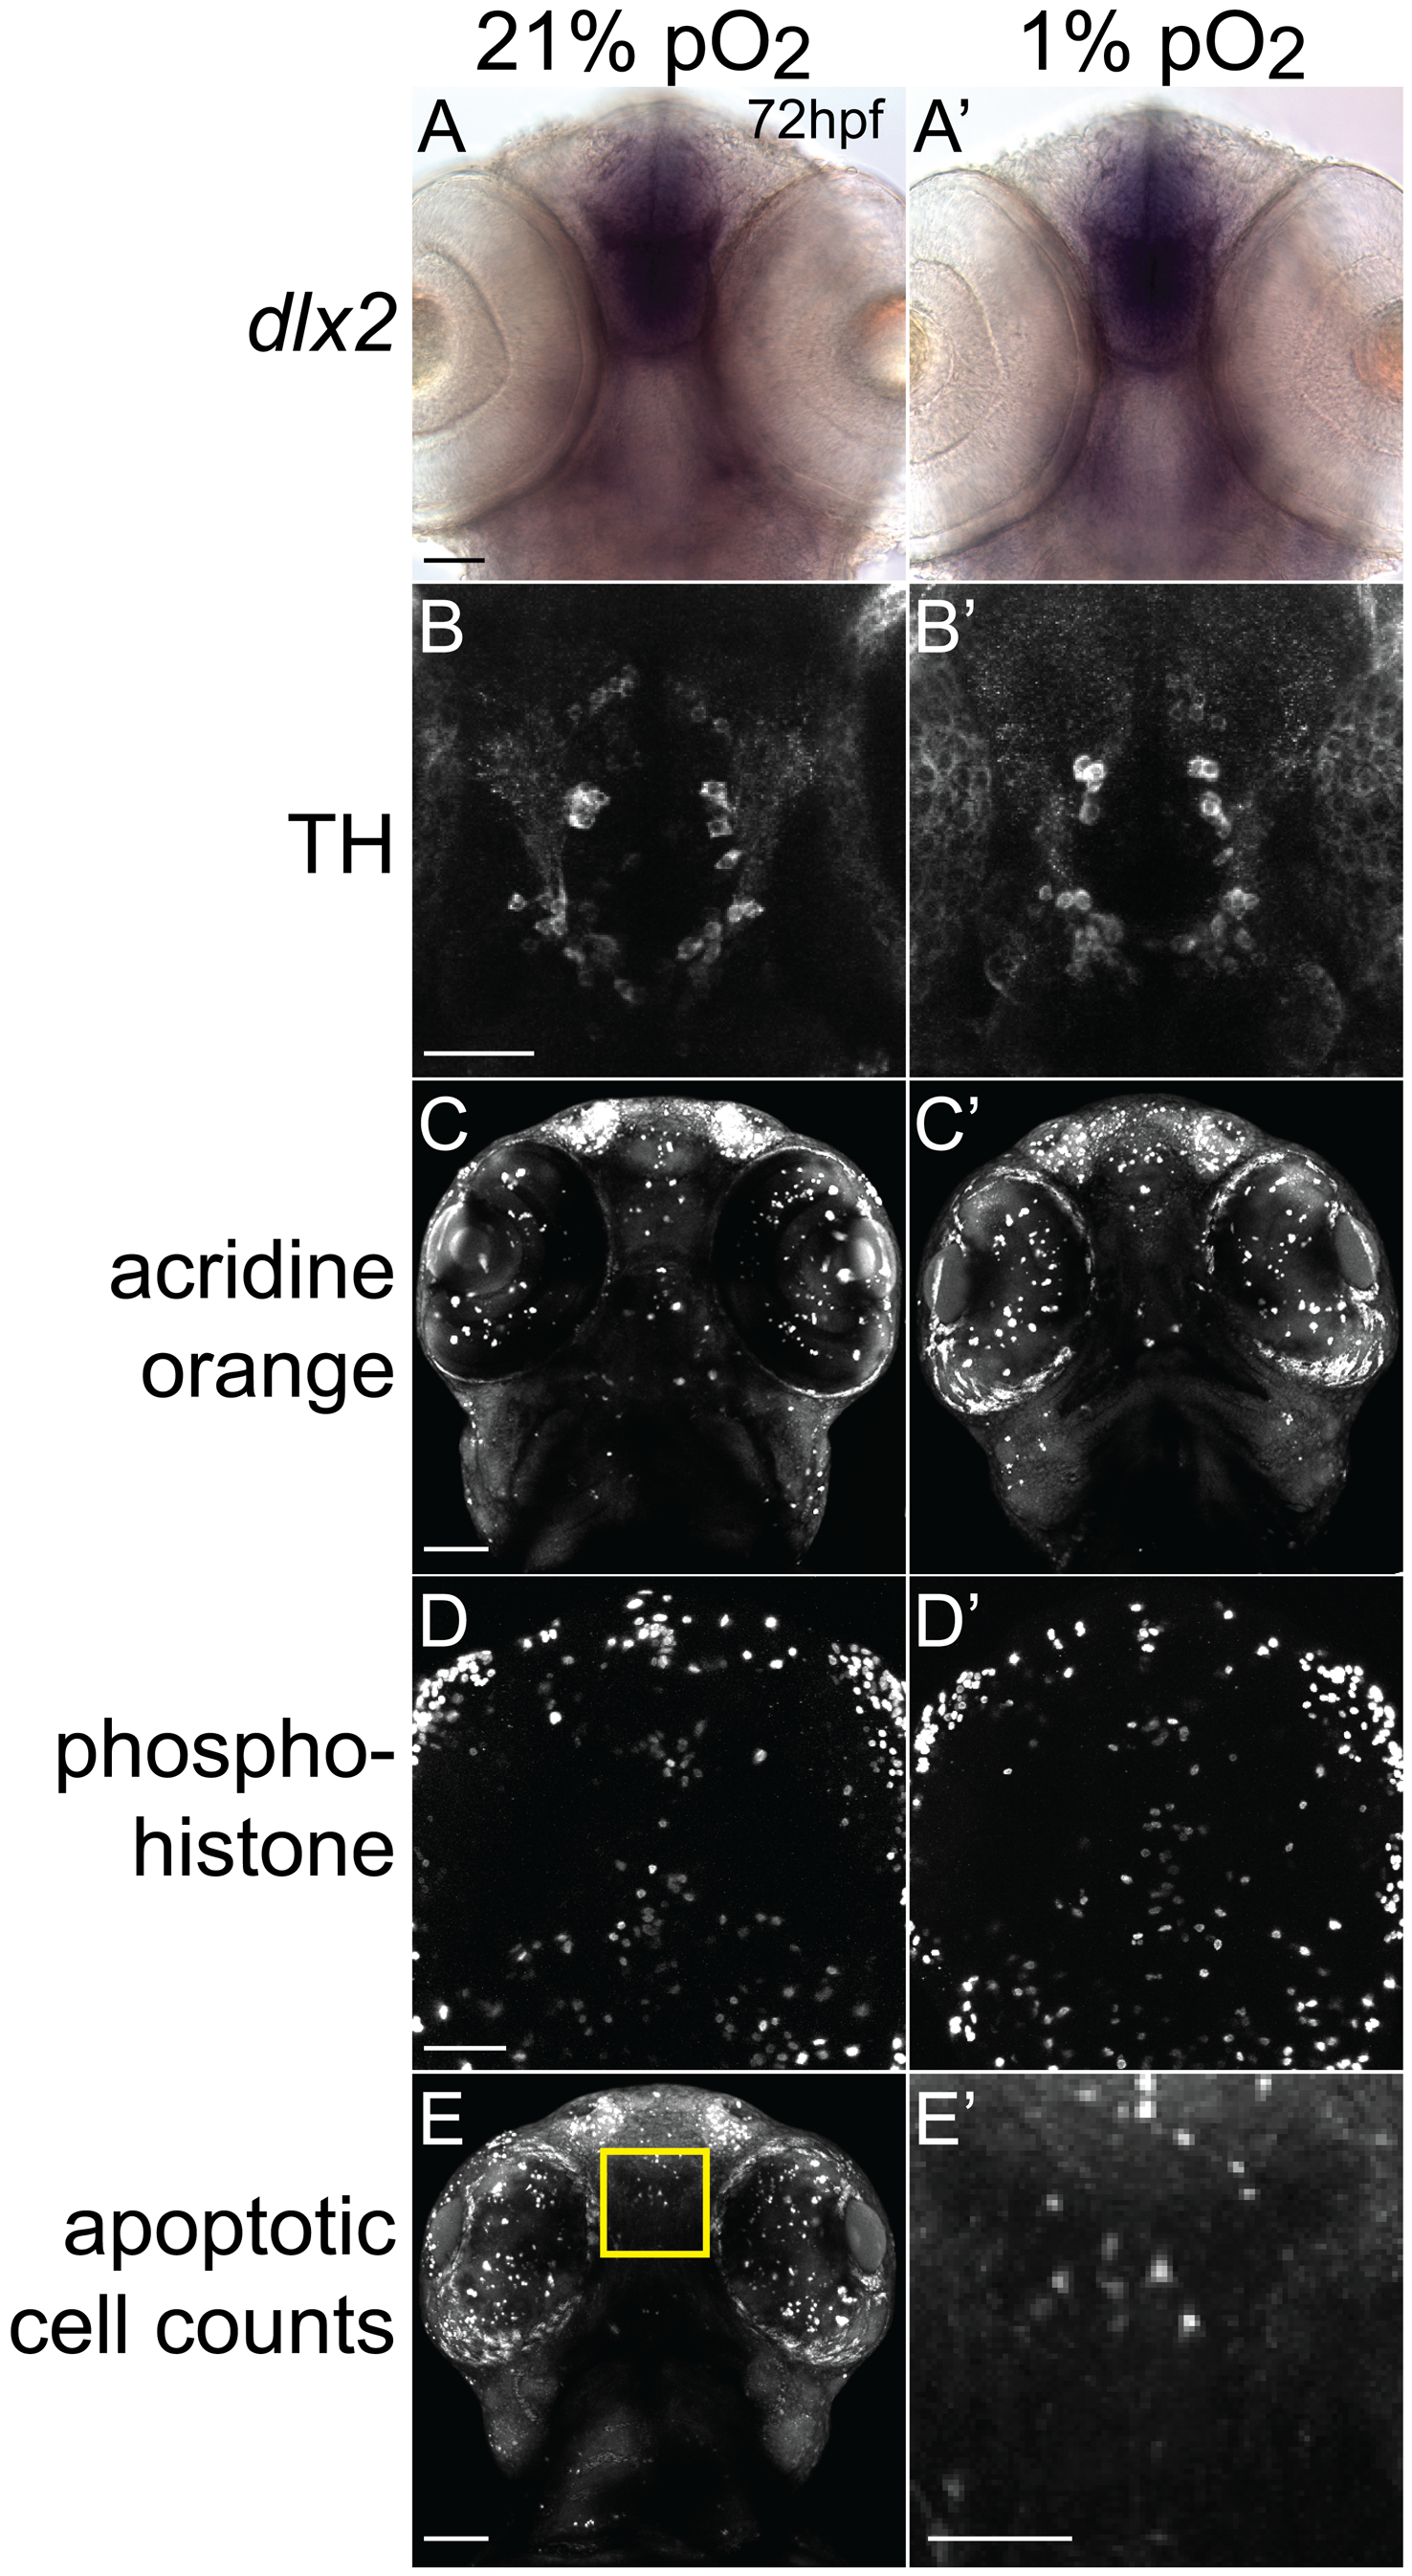
Fig. 3
Developmental hypoxia does not affect general CNS development.
Ventral views, rostral to the top, scale bar 50 μm (except E2, 25 μm). Whole-mount embryos, shown as brightfield (A), or confocal maximum intensity z-projections (B–E). (A, A2) in situ hybridization for dlx2 shows no difference in pattern. (B, B2) α-tyrosine hydroxylase (TH) antibody staining pattern is unaffected. (C, C2) Acridine orange shows similar numbers of apoptotic cells. (D, D2) Phospho-histone H3 antibody staining shows similar numbers of mitotic cells. (E) Confocal image of acridine orange stain demonstrating region for determining apoptotic cell counts. Inset shows high-magnification (E2) for counting cells in the 100 μm×100 μm area.