
Fig. S8
- ID
- ZDB-IMAGE-120601-17
- Publication
- Chablais et al., 2012 - The regenerative capacity of the zebrafish heart is dependent on TGFβ signaling
- All Figures
- Figures for Chablais et al., 2012
|
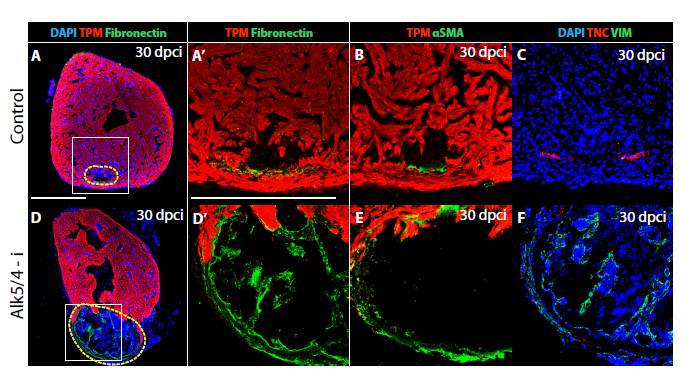
Fig. S8
Cellular composition of the post-infarct after inhibition of TGFβ/Activin signaling. (A-F) Immunostaining of heart sections at 30 dpci using different markers. (A,D) Tropomyosin (TPM, red) labels cardiac muscle, the adhesive matrix glycoprotein Fibronectin (green) marks the connective tissue and DAPI visualizes the nuclei (blue). (A′,D′) Higher magnifications of the framed area in the corresponding left panels. (B,E) Tropomyosin (TPM, red) and α-smooth muscle actin (αSMA, green), a marker of myofibroblasts. (C,F) The de-adhesive matrix protein Tenascin C (TNC, red), fibroblast marker Vimentin (VIM, green) and DAPI (blue). (A-C) Consecutive sections of control hearts demonstrate a nearly complete replacement of the fibrotic tissue with Tropomyosin-expressing cardiomyocytes. Residual Fibronectin, αSMA and Tenascin C demarcate the initial injury site. (D-F) Consecutive sections of Alk5/4-i-treated hearts reveal a large Tropomyosin-negative area, which demarcates a lack of cardiac regeneration (yellow dashed line). The injury area comprises a network of connective tissue visualized by Fibronectin and Vimentin expression. A layer of myofibroblasts is located at the periphery of the post-infarct. Scale bar: 300 μm.