
|
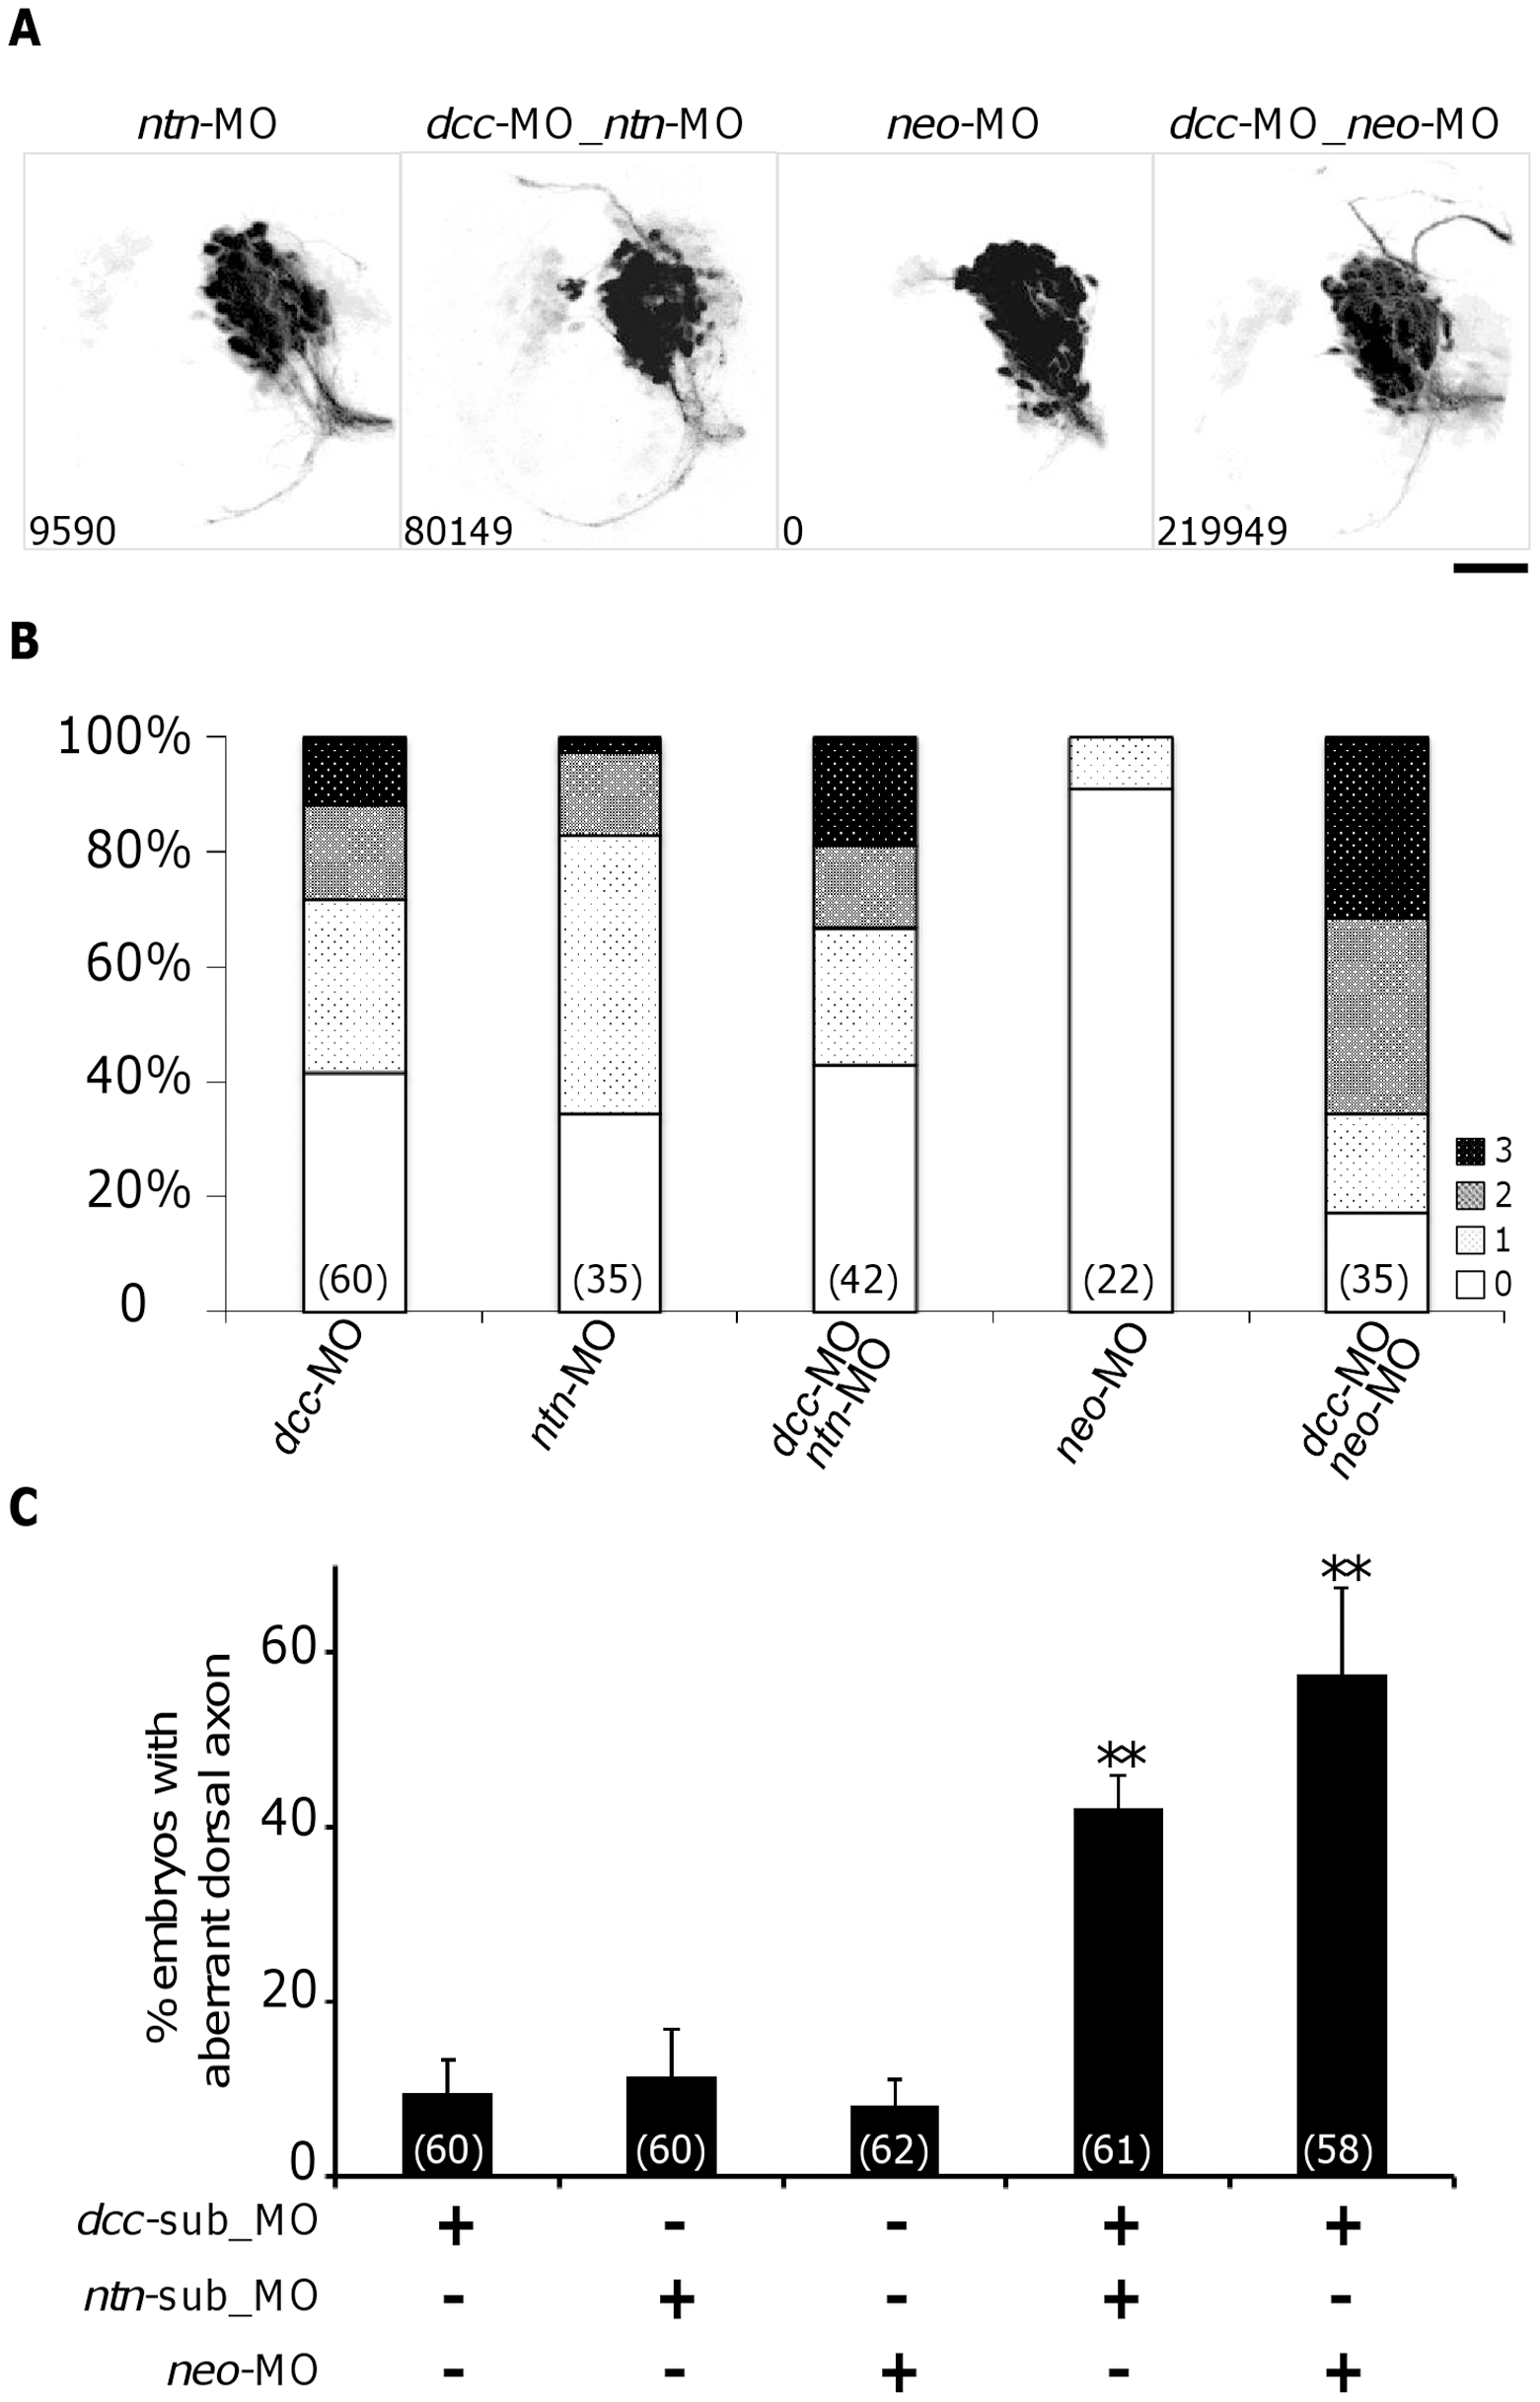
Fig. 5
Effects of inhibition of Netrin1 or Neogenin1 function on the ADt axons.
(A) ADt neurons project axons dorsally when Netrin1 function is inhibited (ntn-MO). Knockdown of Neogenin1 function doesn’t cause ADt neuron to project axon dorsally (neo-MO). Images were processed as in Fig. 3B. The pixel intensity value of aberrant axon is shown in the bottom left corner of each panel. Scale bar = 50 μm. (B) Quantitation of ADt neuronal axon defects. Horizontal axis shows the treatment group labels and vertical axis shows the percentage of embryos in each phenotypic category (Grade 0–3) for each treatment group. Numbers inside parentheses denote numbers of animals analyzed for each treatment group. (C) Synergistic effects between sub-threshold Dcc-Netrin1 and Dcc-Neogenin morpholino knockdowns. dcc-sub_MO and ntn-sub_MO: sub-threshold concentration morpholino. At least three independent injections were performed for each treatment group. Numbers inside parentheses denote numbers of animals analyzed. Asterisks represent p<0.001 by ANOVA test.